Getting Started 1
In this tutorial you will connect AMI to an external datasource, an SQLite database, retrieve data from it and display the data in a table. You will then use AMIScript to customize the way that some data in the table is presented.
Tutorial Guide
This series of tutorials are presented in two formats: text and video. This page is an example of the textual version of the first tutorial. Embedded in this page are a number of videos:
- A video showing the outcome of the tutorial. This allows you to see what you will make over the course of the tutorial and see the key features developed.
- A 'follow-along' style video that goes through the tutorial, showing the steps via screen recording and voiceover. This video is broken into chapters that match the headings in the text version, allowing you to quickly swap between them.
Each tutorial makes use of a large number of reference images showing steps, important features and drawing attention to parts of the user interface. As there are a large number of images they are very often grouped into tabs; with each image given a title. The text will often refer to an image by its title (in bold).
An example of this is show below: there are two tabs Image One and Image Two. Try clicking on them to view the two different images.


Tutorial Objectives
- Introduce the AMI data model by using
DatasourcesandDatamodels. - Retrieve data from a table in an SQLite Database and store it in a
datamodel. -
Use the following components to visualize data in a
datamodel:- Windows.
- Tables.
-
Introduce programming within AMI by using
AMI Script.
Videos
End Product
The video below showcases the result of this tutorial.
Follow Along
The video below covers the same content presented in this tutorial but in a code-along style.
Getting Started
Ensure that AMI is installed and, if appropriate, licensed. See here for instructions.
-
Run
AMI Oneand wait for the portal page to load.- If for some reason it doesn't automatically load, go to the following address in your web browser:
http://localhost:33332/portal/portal.jsp
- If for some reason it doesn't automatically load, go to the following address in your web browser:
-
Log in using the username
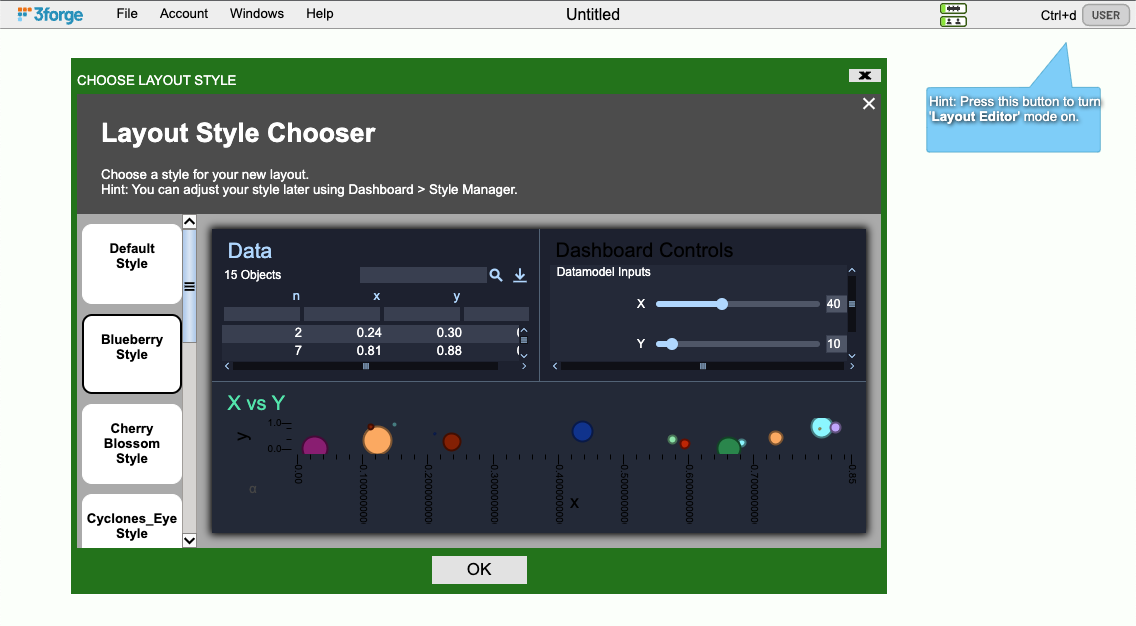
demoand the passworddemo123. - On the following screen select
Blueberry Styleand clickOKso that the interface matches the style used in these tutorial videos and images:
AMI User Interface
AMI has two different modes:
User- Used to view, interact with and use applications you create.Editor- Used to create, debug and develop your AMI applications.
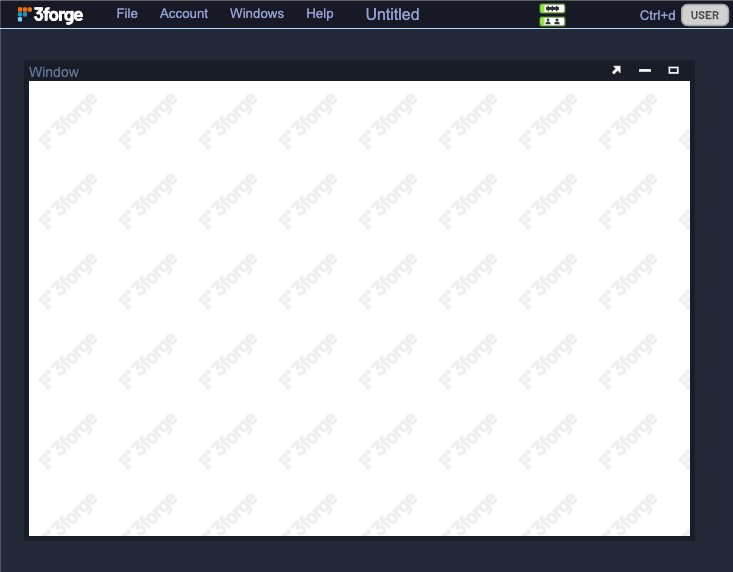
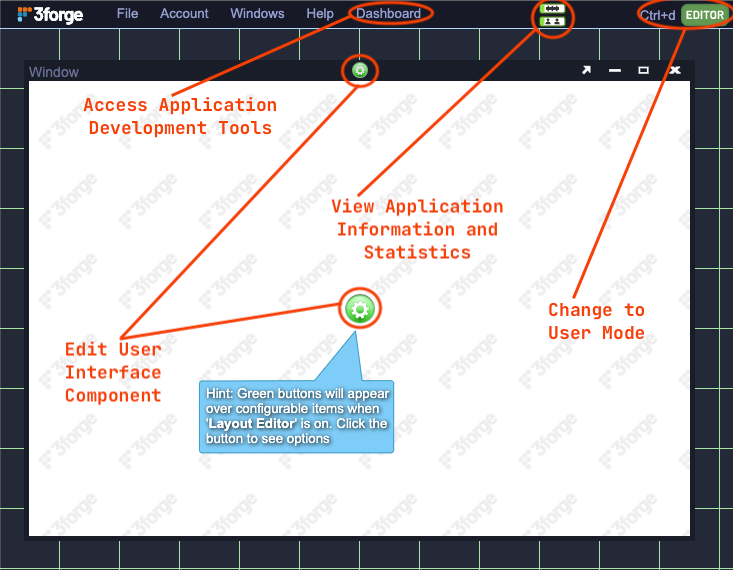
The images below show the same content in both User and Editor mode:
You can toggle between the two modes either using Ctrl-D on your keyboard or by clicking the USER or EDITOR toggle in the upper right hand corner of the interface.
Selecting Editor mode will change the User Interface in the following ways:
- The background will show a green hatching.
- User Interface components will show a green
Gearicon that can be used to configure them. - An additional dropdown menu,
Dashboard, will appear at the top of the screen. - Some options in dropdown menus will become enabled (such as saving).
Over the course of these tutorials you will be swapping between Editor and User modes frequently to develop and test the tutorial application.
Making the Data Available
Before interacting with data in AMI it is important to understand the following concepts:
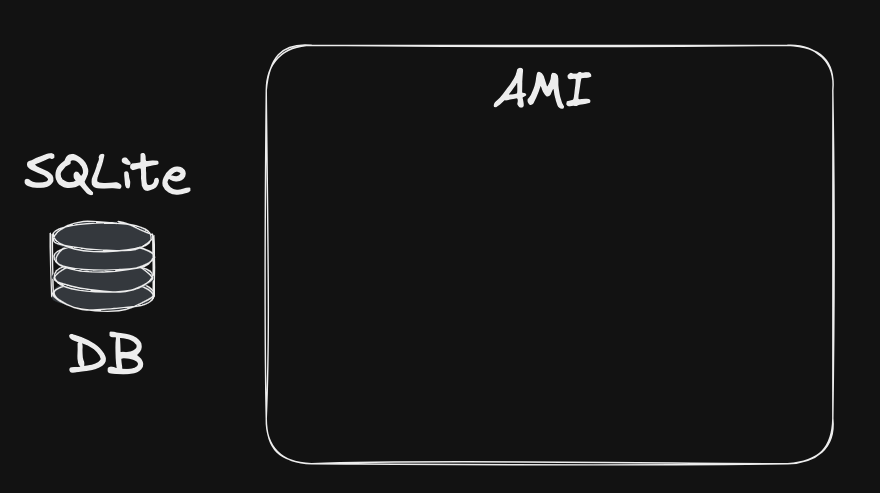
-
Datasources- These are connections to a source of data. AMI can connect to a wide variety of data sources including relational and non-relational databases, in-memory databases, online datasets and message streams.- Each
datasourceneeds a unique name. - Adding a
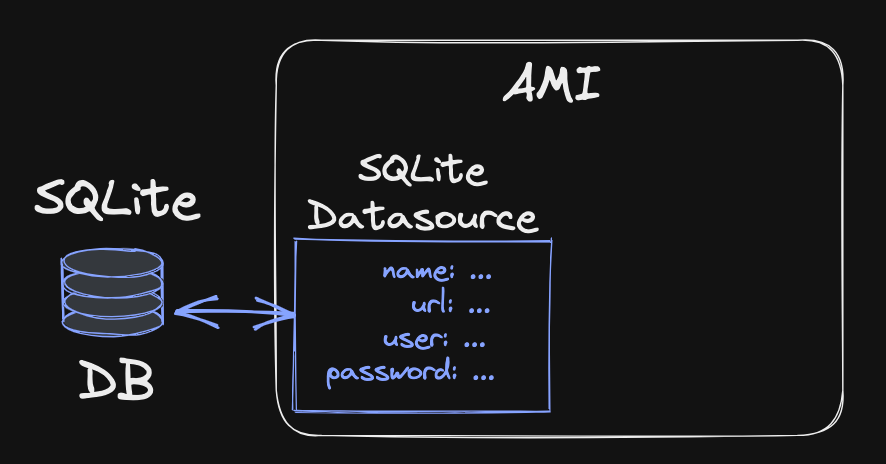
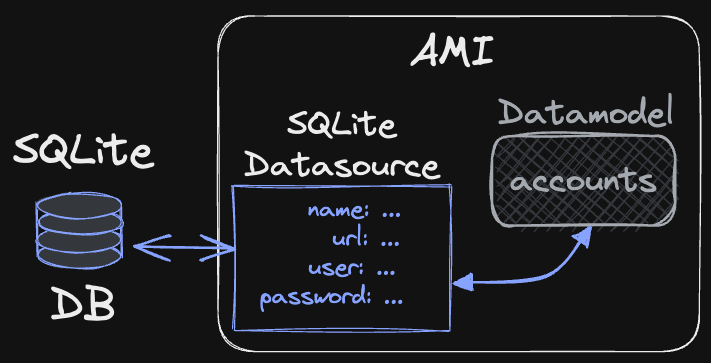
datasourceto AMI defines the information required to connect to it and provides an internal name for that source of data. - Once attached, a
datasourcecan be used to ingest data into one (or more)data models. - AMI always comes with one
datasourcepredefined - theAMI Realtime Database.
- Each
-
Datamodels- These are named collections of data held in-memory by AMI.-
Datamodelscan be created and populated:- with data from one or more
datasources. - with data from one or more
datamodels. - programmatically using AMI script.
- with data from one or more
-
Static User Interface components like tables and visualizations are constructed on top of a
datamodel. - Data held in data models is stored per user session. If 10 users connect to the application there will be 10 copies of the datamodels.
-
The first thing we are going to do is to connect AMI to a source of data. For these tutorials you will be using an SQLite database that is included in with the AMI install. Before you can make use of the data, by creating tables or charts, you need to do the following:
- Determine the datasource and take note of its location and other configuration information such as access username and password.
- Attach a
datasourcewithin AMI to hold the above information. - Create a
datamodelto query thedatasourceand hold the data returned.
Attaching the Datasource
Ensure that you are in Editor mode.
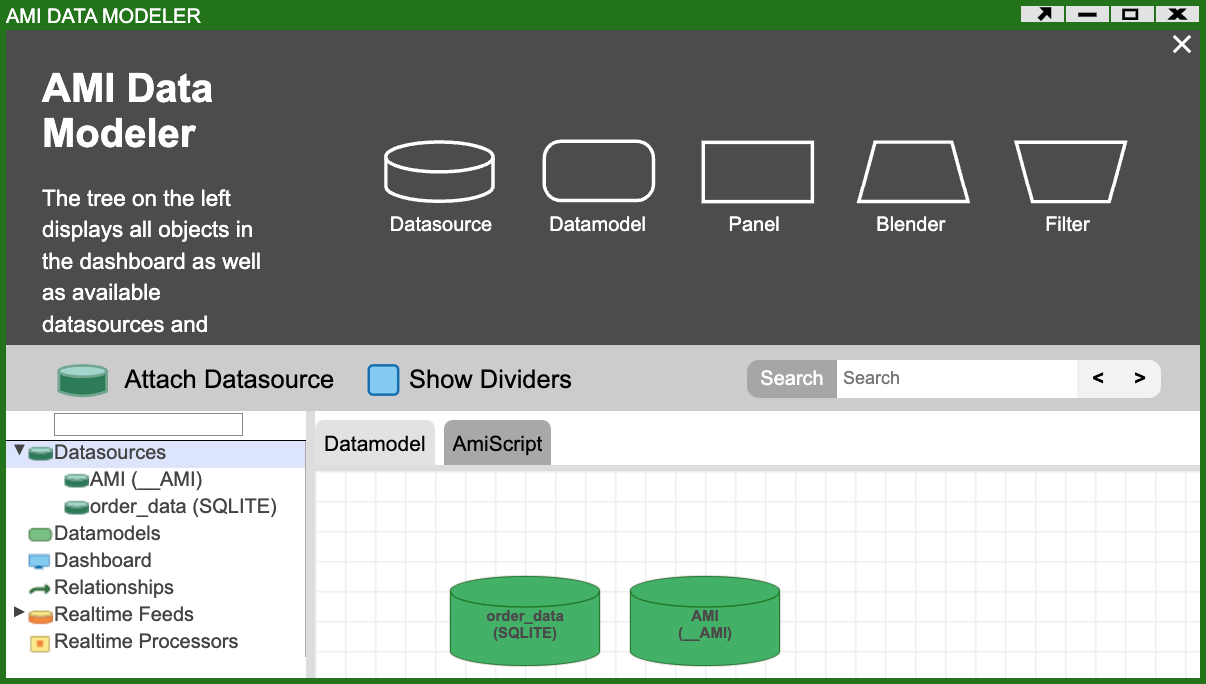
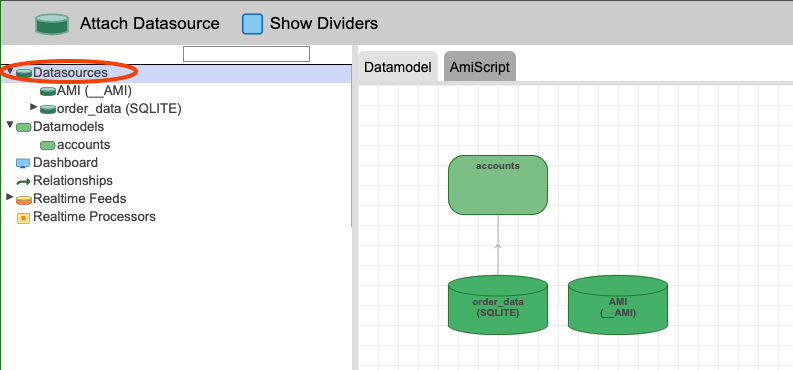
Select the Dashboard Menu at the top of screen and click on Data Modeler, this will open the Data Modeler tool shown below.
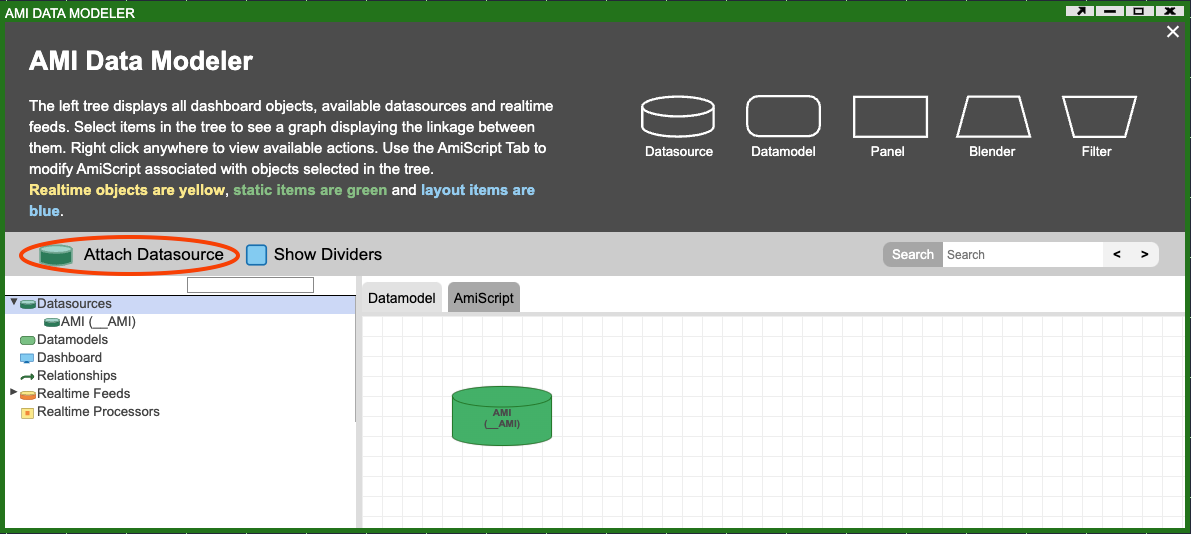
The Data Modeler shows all of the datasources and datamodels that you have created as well as information on the dashboard (user interface), real-time data and relationships. If you expand the Datasources item in the list on the left side of the screen, you will see that there is only one existing datasource: 'AMI' ( the AMI Realtime Database). Selecting different items in the list on the left will update the diagram on the right.
Click on the Attach Datasource button to open the window below where you can choose the type of Datasource you would like to attach and configure it appropriately.
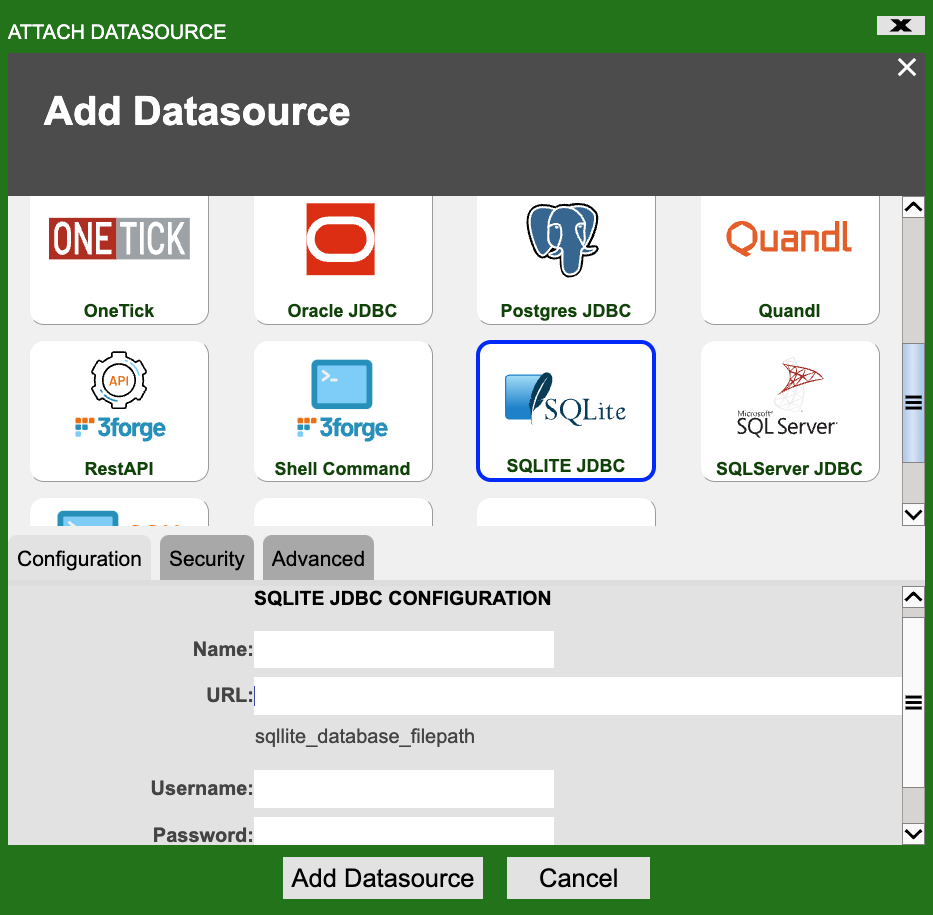
In the scrollable panel at the top find the SQLITE JDBC option (highlighted in the image above).
Different datasources will require different configuration. For the tutorial SQLite database you just need to provide:
- A unique name for the
datasource. - The URL (location) of the SQLite database file.
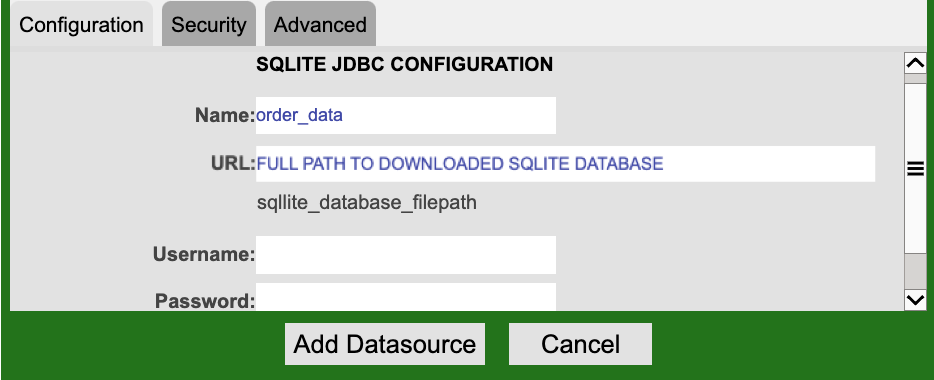
The names you give datasources should be descriptive: as the SQLite database holds information on a number of accounts and related orders you should name the datasource order_data.
The SQLite database can be downloaded from the following link. Once downloaded you will be able to get the full path(URL) of the database file.
The Datasource Details image above shows the relevant details populated.
Once you have entered the details click on the Add Datasource button.
Datasource added
If the process is successful the following dialog will be shown.
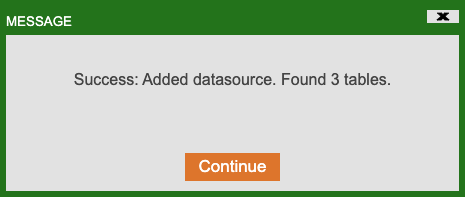
Make sure that the number of 'Found tables' is NOT 0.
- If it is, in the Data Modeler, right click on the newly attached order_data
datasourceselect Edit and double check the URL to the SQLite database file.
Click OK.
Something went wrong?
While AMI is attempting to attach the datasource the Add Datasource button will be replaced with a disabled Waiting for Response button. It may take a few seconds but if there is an issue attaching the datasource a Message dialog will appear containing information on the problem.
- Double check the URL to the SQLite database file you provided is correct.
The Data Modeler should now show both the AMI and order_data datasources.
Creating a Datamodel
Info
AMI now knows that a datasource called order_data exists and is able to connect to it but no data has yet been retrieved from it.
You will now create a datamodel that will query the order_data datasource and retrieve data about a number of accounts.
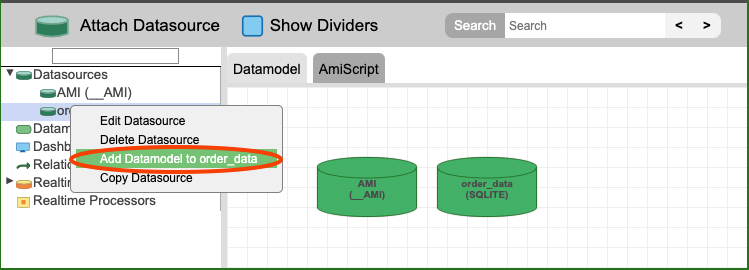
In the Data Modeler, right click on the order_data datasource either:
- in the list on the left-hand side or
- in the diagram in the center of the screen.
Click on the Add Datamodel to order_data menu item.
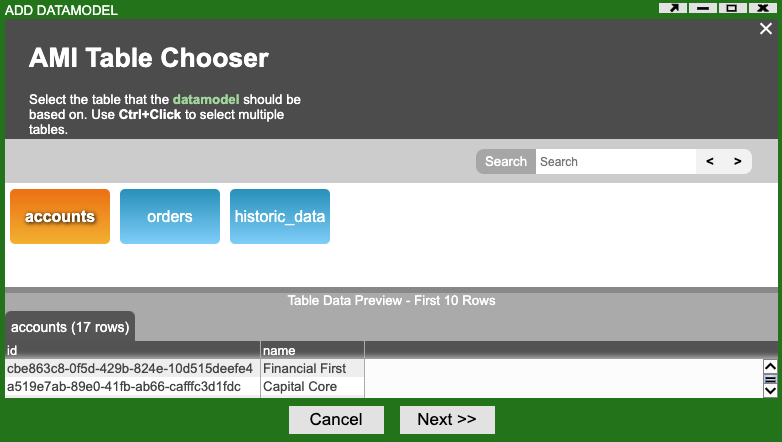
- A number of tables (collections of data) should be detected and shown in the upper section of the window (see the Choose Table image above).
- Select the
accountstable by clicking on it, turning it orange. The bottom section of the window should show a preview of the data that has been retrieved from the table. Theaccountstable holds a unique identifier and a name for each account. - Click Next.
The Add Datamodel Editor
The Add Datamodel window will open allowing you to configure and modify the new datamodel in a variety of different ways.
The window is broadly split into:
- An AMI Script editor at the top that contains the code to create a table and populate it with data from the
datasource. If you are familiar with SQL you may notice that AMI Script includes a similar syntax. The code to the right of theEXECUTEkeyword IS SQL. - Information tabs (Errors, Logs, Event Viewer,...) at the bottom that assist you in configuring, developing and testing the
datamodel. - A list of user interface elements in the upper right corner. This allows you to include information from the user interface in a datamodel.
Info
You will cover each of these in more detail in subsequent tutorials
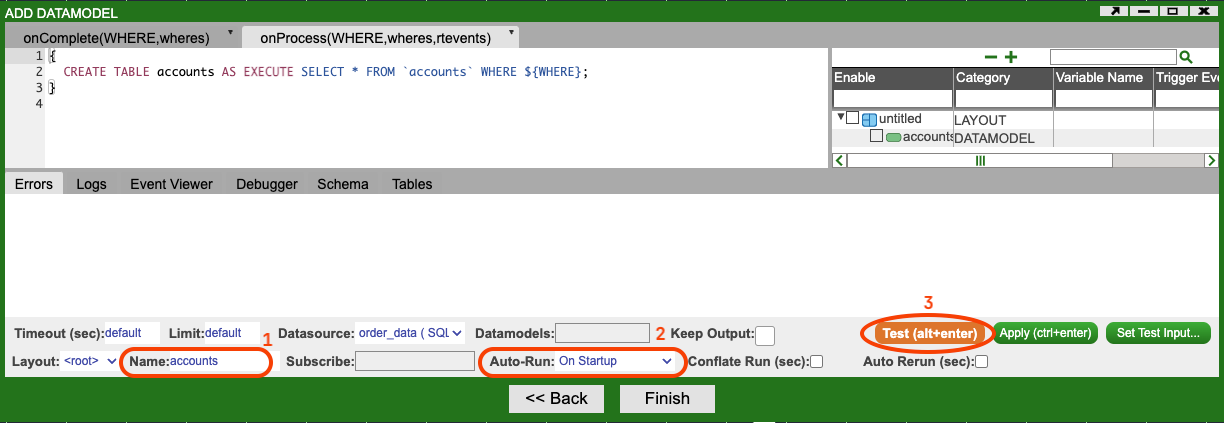
For now we will focus on three things:
- The Name - Each Datamodel should have a unique name. By default yours will be called
accountswhich you should leave unchanged. - Auto-Run - Datamodels can be configured to run (retrieve data) on certain conditions. You should leave this on
On Startupwhich will cause thedatamodelto be run once on application startup. The data held in the accounts table (in the SQLite database) changes very rarely and so it is not necessary to re-run thedatamodelto obtain updated information. - Test - You are strongly encouraged to test the
datamodelbefore continuing. This can be done using the orange Test button.
Click on the Test button.
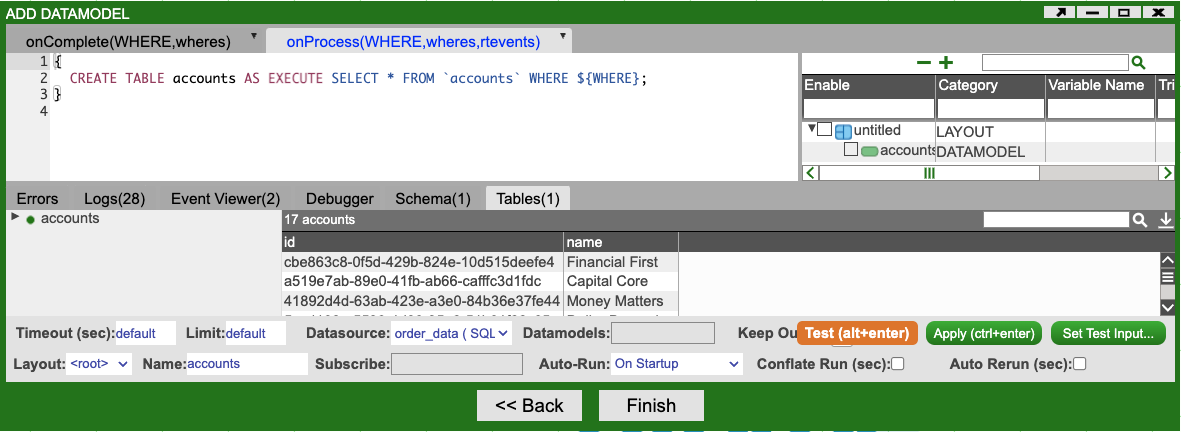
The window will update and select the Tables(1) tab at the bottom of the window. This will show data that:
- has been retrieved, via the
order_datadatasourceand - stored in a table called
accounts - that is part of a
datamodelcalledaccounts.
Info
It is possible for a datamodel to contain multiple tables but, for this tutorial, you only need one.
Click Finish
The Data Modeler will now show your new datamodel and the connection to the datasource that it uses to retrieve data.
Visualizing a Datamodel with a Table
At this point in the tutorial you have configured AMI to retrieve data from an external resource and store it in a datamodel. You will now create a simple table visualization to enable you to explore the data within AMI.
Create a Window
Ensure you are in Editor mode and create a new Window.
- Select the Windows Menu at the top of the screen.
- Select New Window.
The resulting window is, essentially, a container for a variety of different visualizations including tables, forms, charts and maps. Windows can be:
- Resized.
- Maximized and minimized.
-
Detached.
- Detached windows become separate browser windows allowing them to be moved independently of the main AMI window.
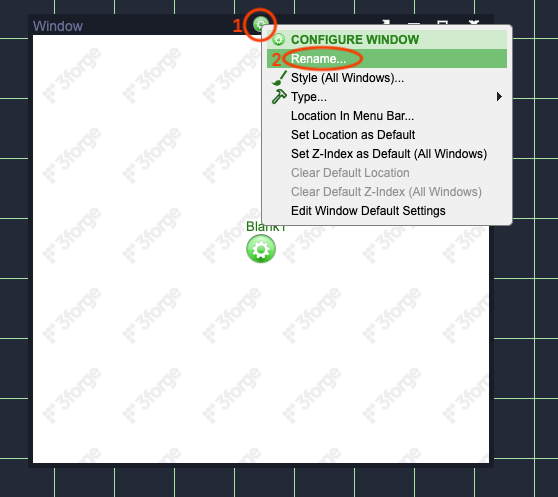
By default the Window has been named Window. Click on the green Gear icon at the top of the window, select Rename... and give it the name 'Order Explorer'.
Add a Table Visualization
The window you created is currently empty, you now need to add a Table Visualizationto it.
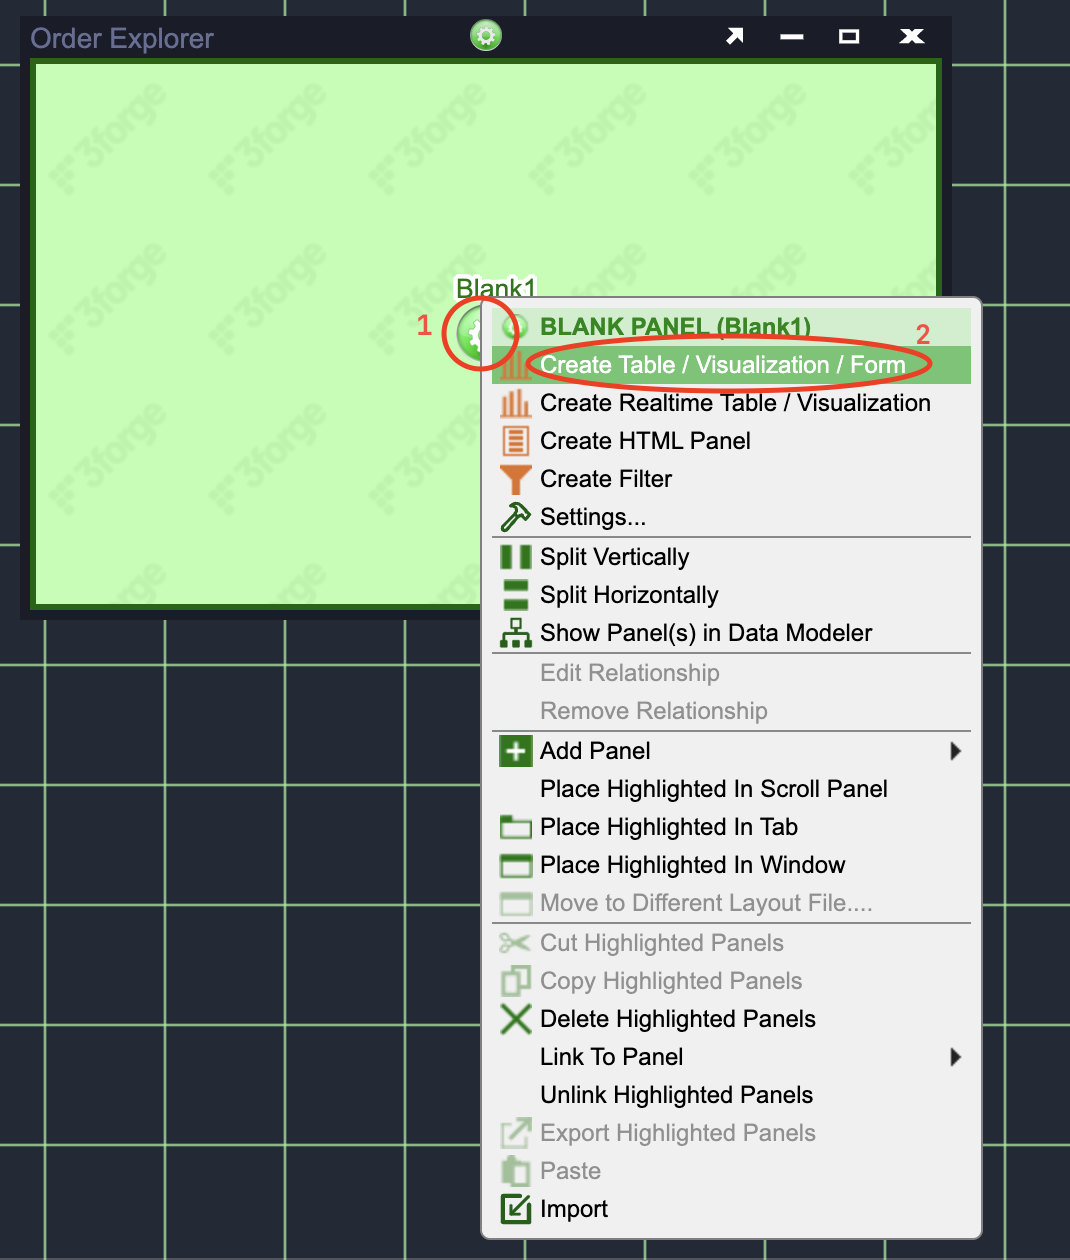
Click on the green Gear icon in the center of the Order Explorer Window and select the Create Table / Visualization / Form menu item.
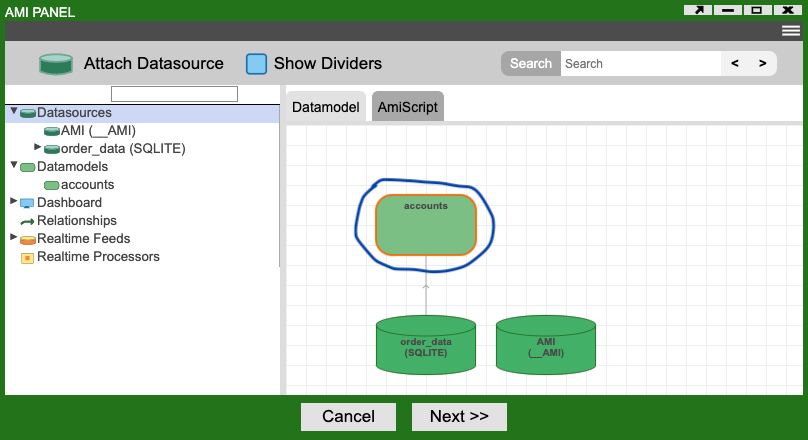
The Data Modeler window will be displayed allowing you to choose the datamodel that the Table Visualization should use. Select the accounts datamodel and click Next (see Select Datamodel image above).
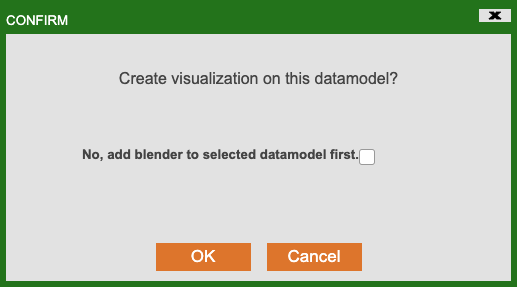
You will be asked to confirm that you want to create a visualization on this datamodel. Click OK.
The AMI Panel window will be displayed allowing you to choose the type of visualization to use. Select the Table option in the upper left corner of the window.
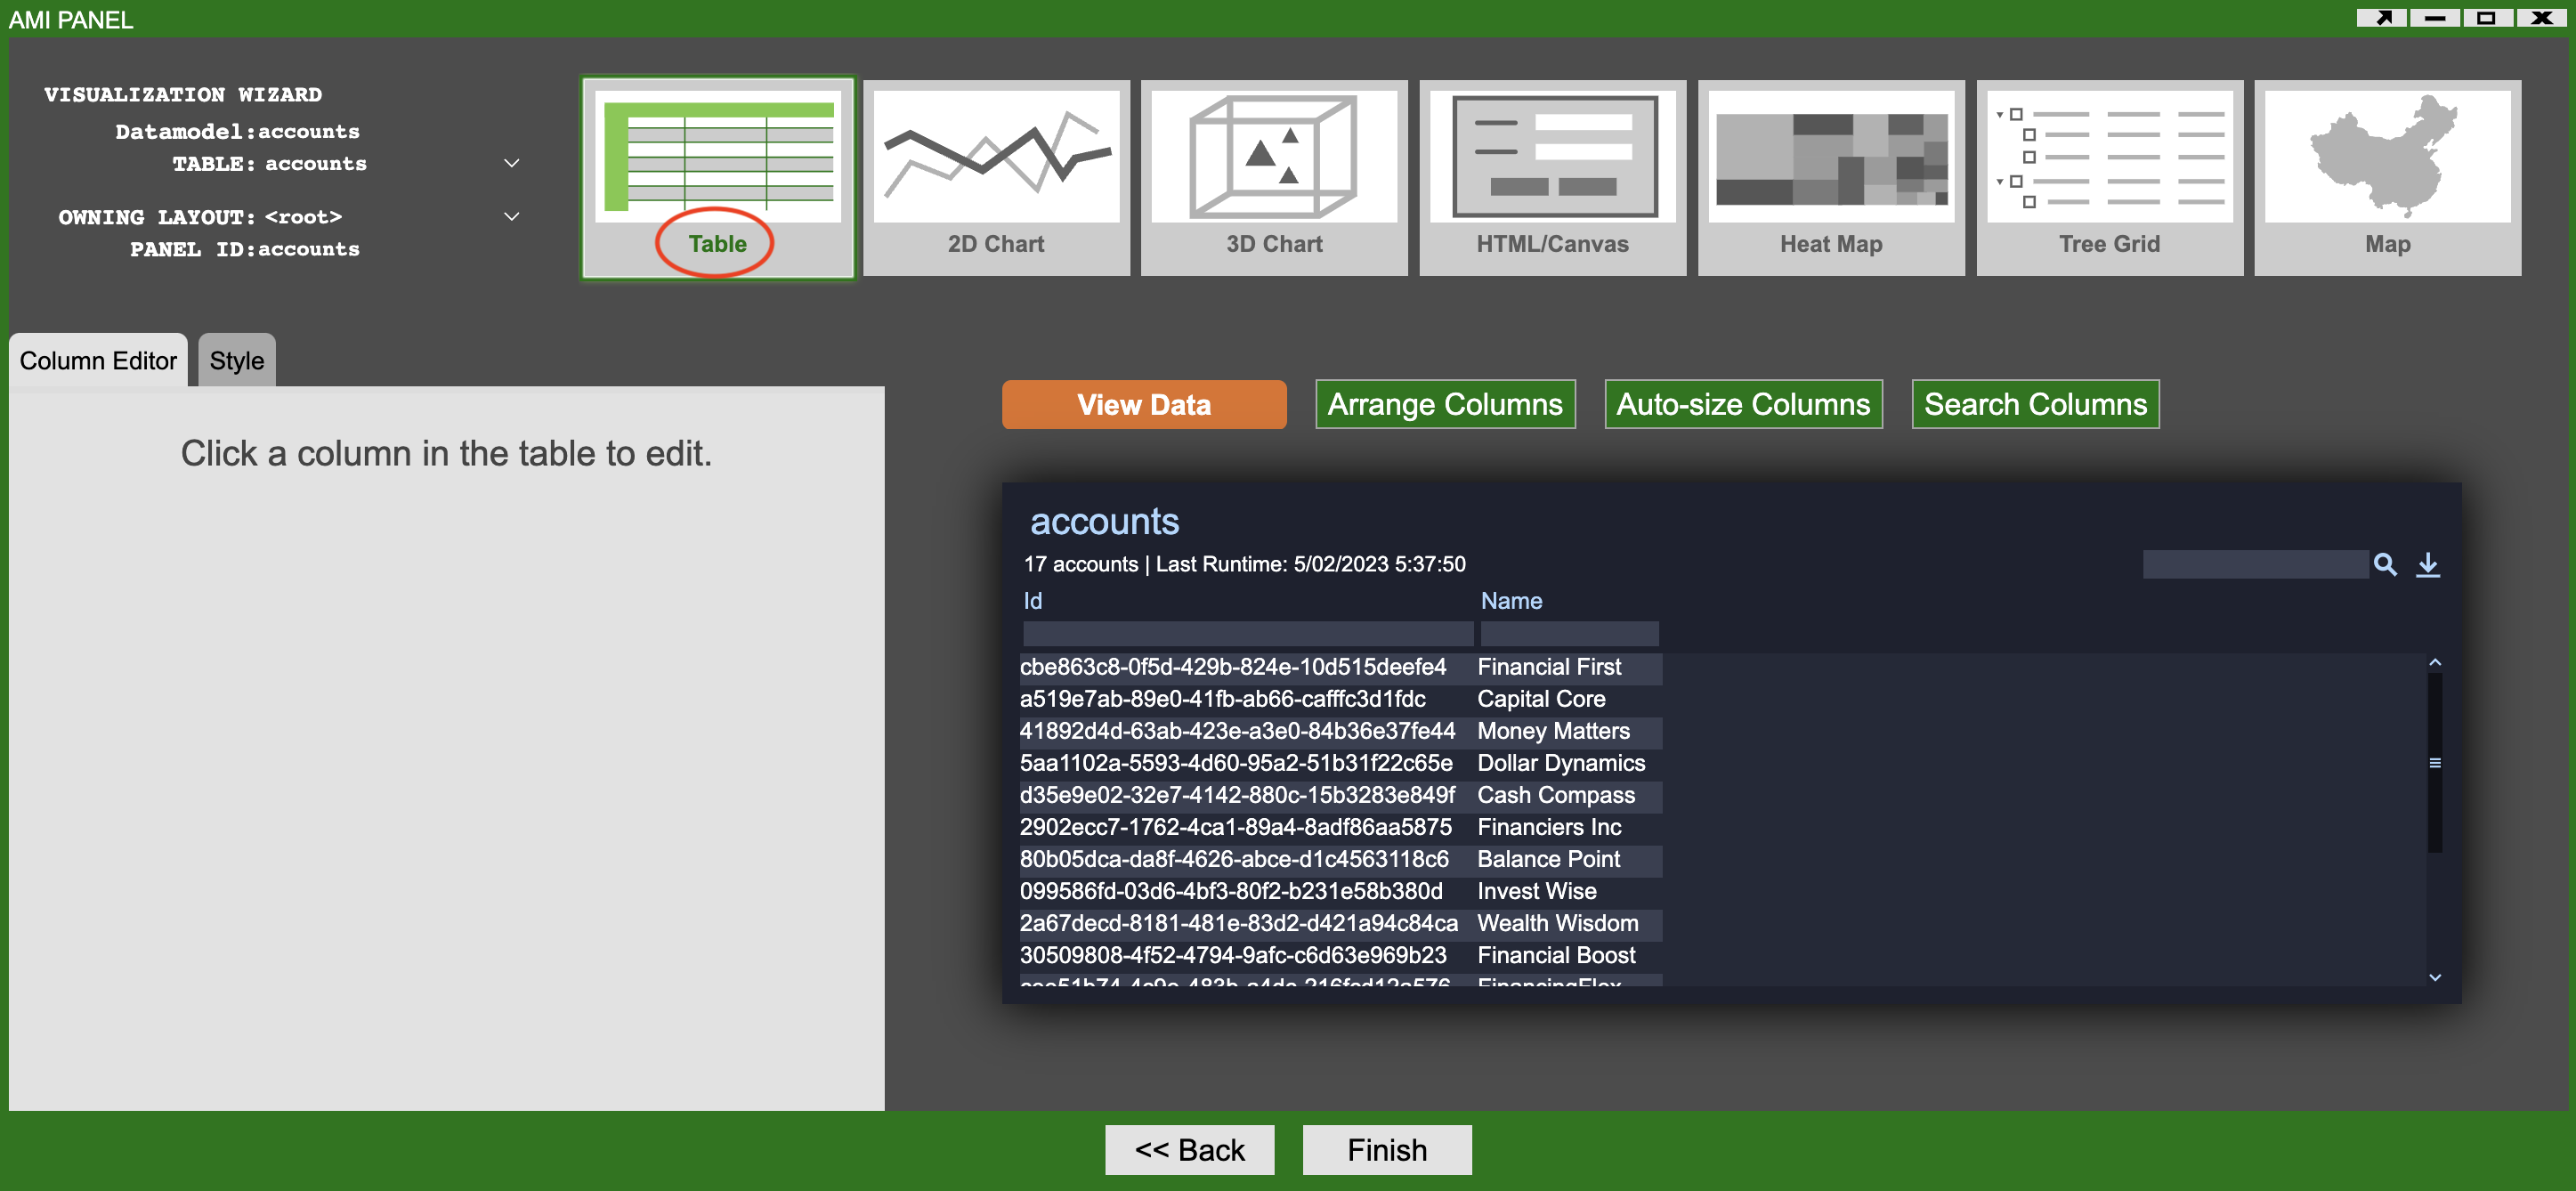
A preview of the Table Visualization, including data, will be shown in the center of the window. Changes to the format and appearance of the Table can be made both:
- Now
- Once the Table Visualization has been created.
Both options will be covered.
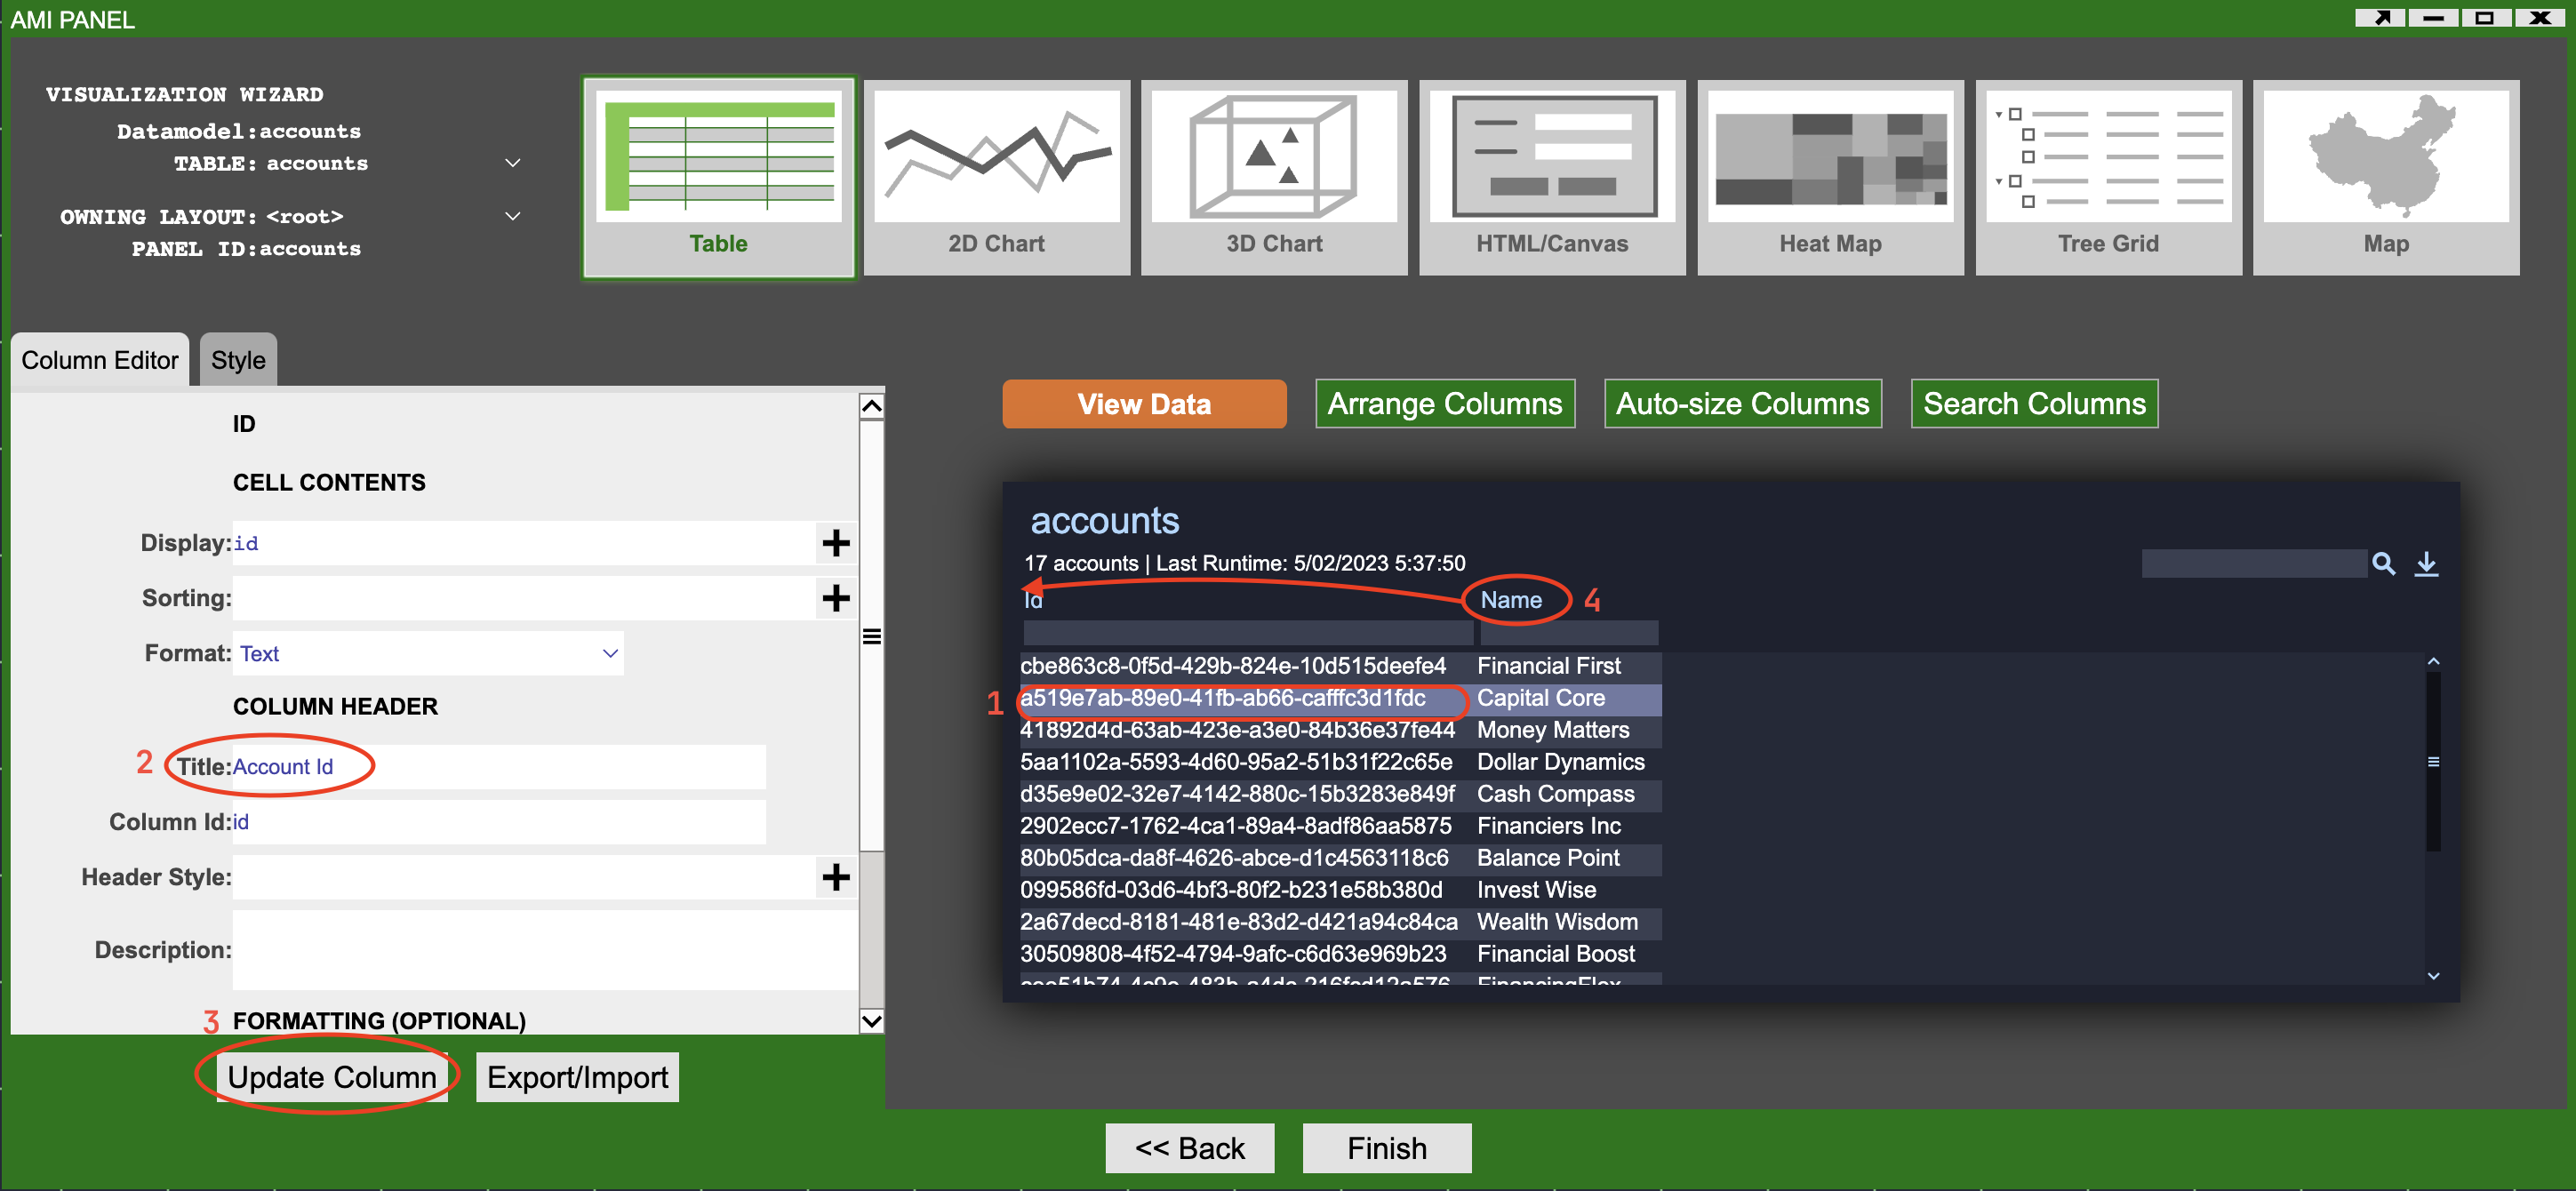
- Select the Id column by clicking on one of the Id's in the Table. Settings for this column will appear on the left.
- Enter the text 'Account Id' in the Title box to change the column title.
- Click on the Update Column button.
- Finally, re-order the columns by left-clicking on the Name column title and dragging it to the left of the Account Id column.
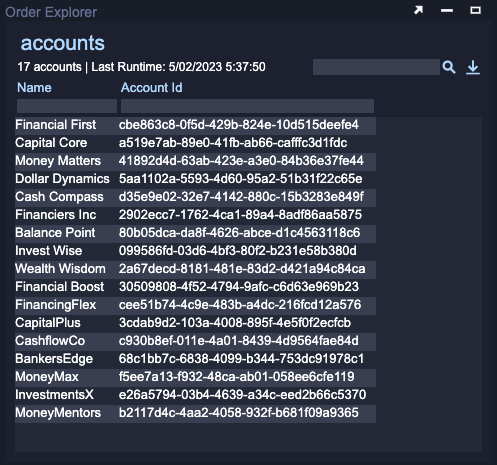
Click on the Finish button.
Using the Table Visualization
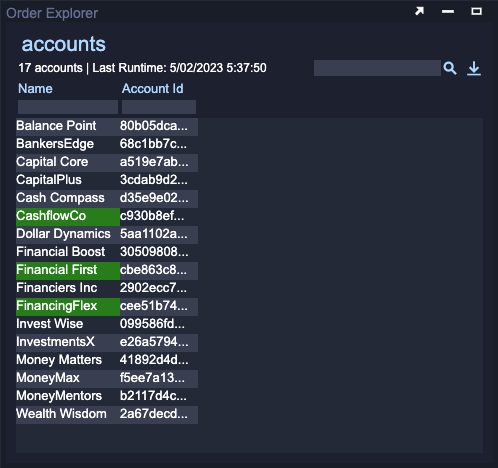
You have now created a Table that is populated with data from an SQLite database. You should see a Table very similar to the one below, make sure to enter User mode:
As well as being able to see the data you can also:
- Search - across all columns.
- Sort - any column.
- Filter - one or more columns.
Examples of each are shown below:
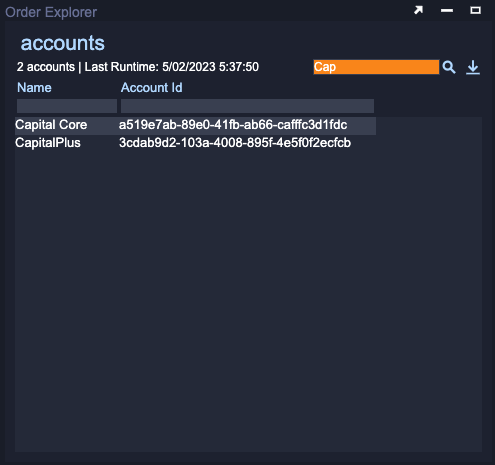
Enter a search term in the box in the upper right corner of the table. In this case rows that contain values starting with 'Cap' are displayed.
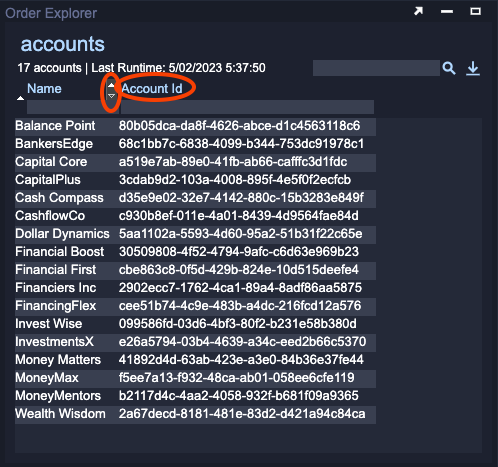
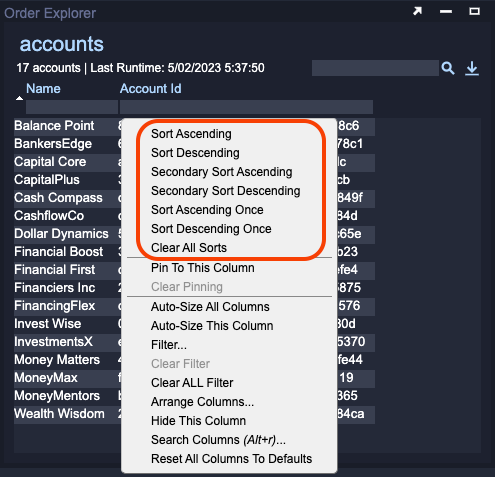
When hovering the mouse over a column name small arrows will appear to the right. Clicking on these will sort the table by that column in either ascending or descending order. You can achieve more complex sorting by clicking on a column name and selecting various sorting options from the menu that appears.
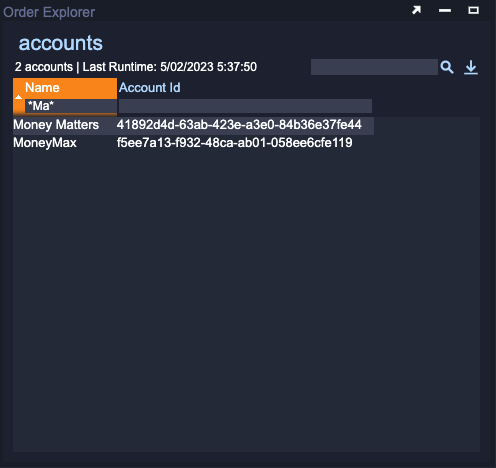
The rows in the table can be filtered based on filters applied to one or more columns. The this case rows containing the letters 'ma' (case insensitive) are shown. The '*' act as a wildcard matching anything. Filters can be applied to multiple columns at once.
Using AMI Script
You will finish this tutorial by writing a small amount of AMI Script to further customize the Table Visualization you created.
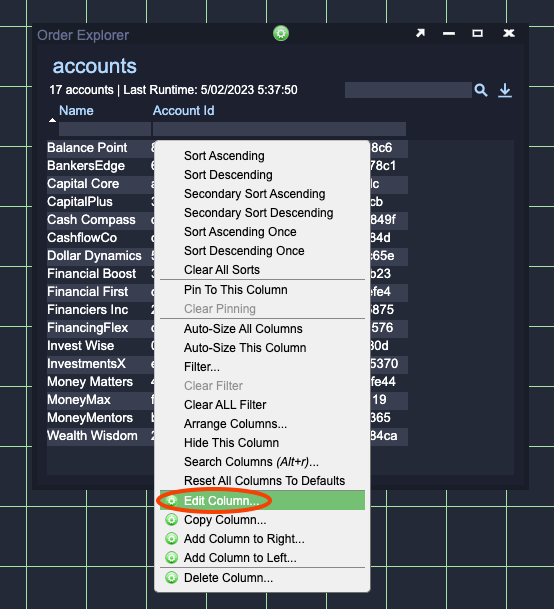
Enter Editor mode, left-click on the Account Id column and choose Edit Column... in the menu:
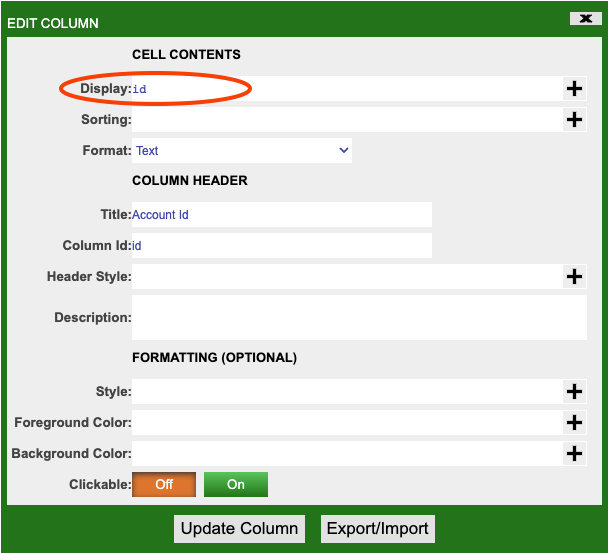
The Edit Column window will appear allowing you to change a number of column settings including its appearance.
A very powerful aspect of AMI is that almost all properties can contain AMI Script allowing for programmatic manipulation of nearly everything. You are going to modify the data shown in the Account Id column by writing some AMI Script in the Display property box:
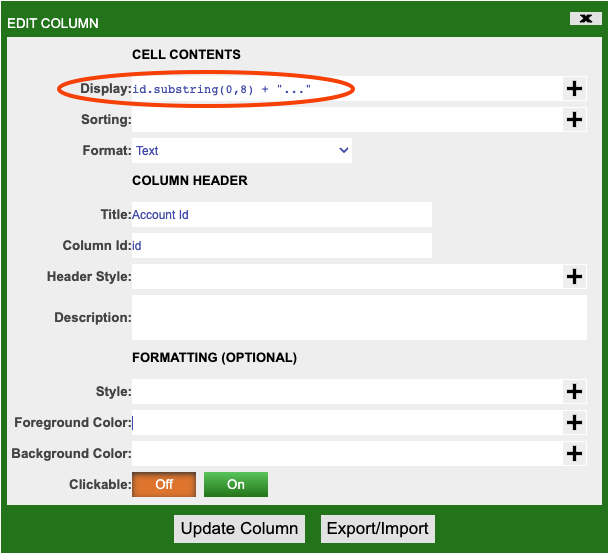
The Account Id is a long string of characters that is visually quite difficult to quickly recognize. The AMI Script below takes a substring of the 'id' (in this case, the first 8 characters) and combines it with the string '...'.
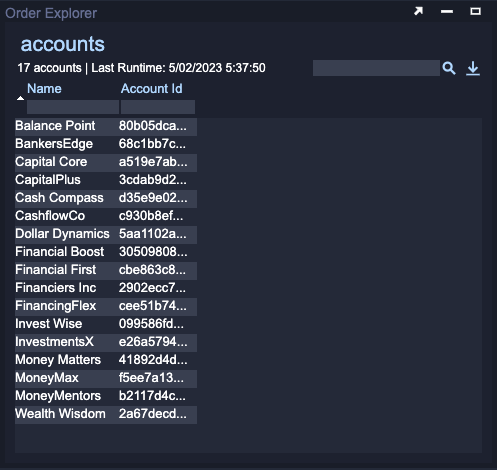
Info
The data in the datamodel has not changed it is only the presentation that is different.
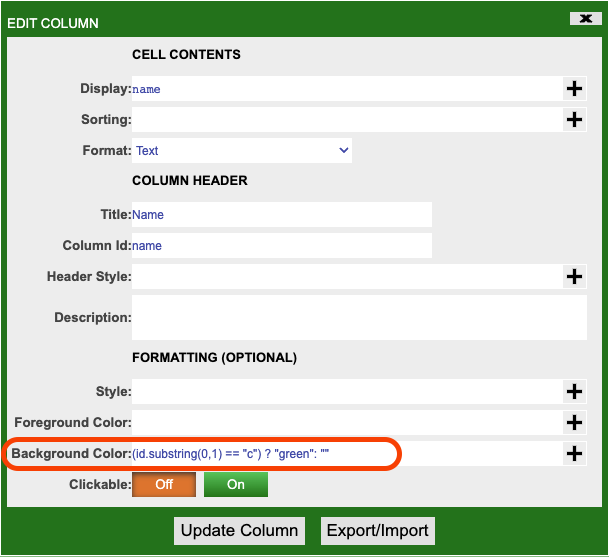
Accounts that have an Account Id starting with c are considered 'important' accounts. Make their backgrounds green to highlight them so that they stand out:
- Left-click on the Name column and select Edit Column...
-
Put the following AMI Script in the Background Color box.
- This code compares the first character of the id with the String
c. If they are equal the background color is set to 'green' otherwise it is left unchanged.
- This code compares the first character of the id with the String
-
Click Update Column.
Info
In subsequent tutorials you will make greater use of AMI script to customize the appearance and behaviour of various built-in visualizations.
Next Tutorial
In the next tutorial you will retrieve data on orders, made by these accounts, from the SQLite database and create a number of data visualizations including an aggregation. You will then link these visualizations together using relationships to allow for a natural exploration of the data.