Getting Started 2
In this tutorial you will retrieve order data from an SQLite database and use it to create a Tree Grid (Grouped Aggregation) visualization of the orders made by accounts. You will use a relationship to connect the accounts and orders visualizations together allowing for intuitive exploration of both account and order data. The mechanism by which relationships work will be explained giving you the understanding necessary to create more complex relationships in the future.
Tutorial Objectives
- Retrieve order data from an existing
datasourceand store it in adatamodel. - Create a Tree Grid (Aggregation) Visualization.
- Use multiple panels to present data and become familiar with splitting panels.
- Connect visualizations together using a
relationship.
Videos
End Product
The video below showcases the result of this tutorial.
Follow Along
The video below covers the same content presented in this tutorial but in a code-along style.
Create the Orders Datamodel
You have already created a datamodel to store information on accounts retrieved via the order_data datasource. In addition to account information the SQLite database contains data on the orders made by each account. To access this data within AMI you need to create a new datamodel.
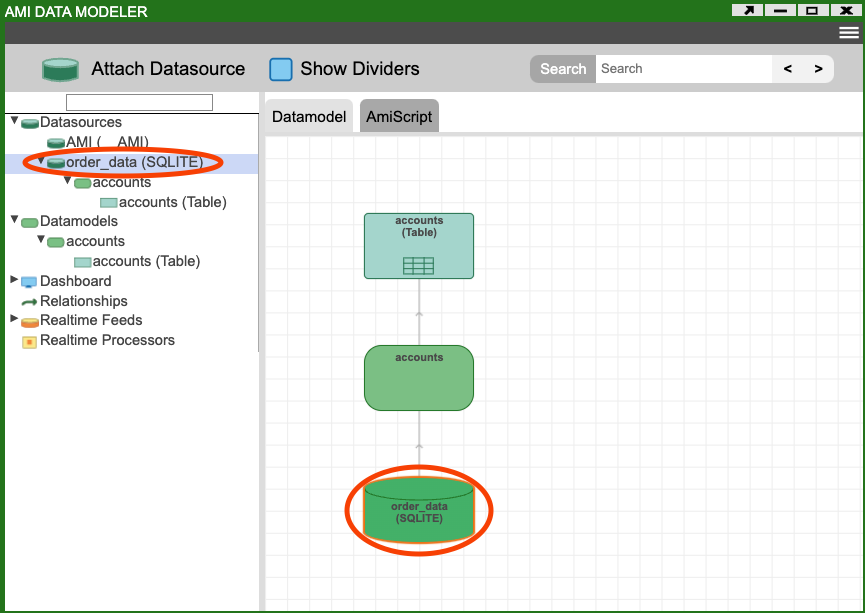
Enter Editor mode and open the Data Modeler, right click on the order_data datasource (either on the left or in the center of the Data Modeler) and select Add Datamodel to order_data.
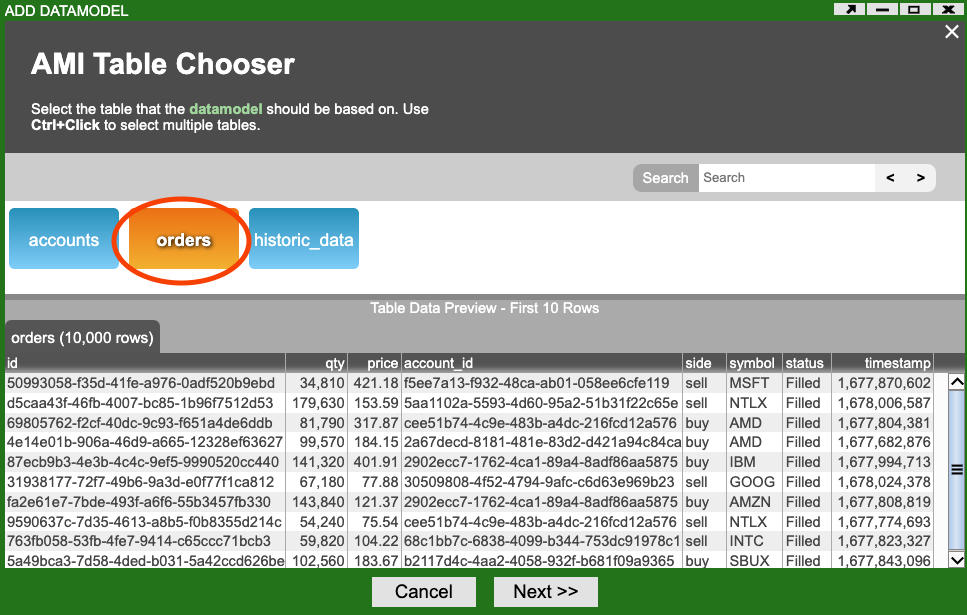
On the AMI Table Chooser window choose the orders table, some example order data should be shown at the bottom of the window (see AMI Table Chooser image above), and click the Next button.
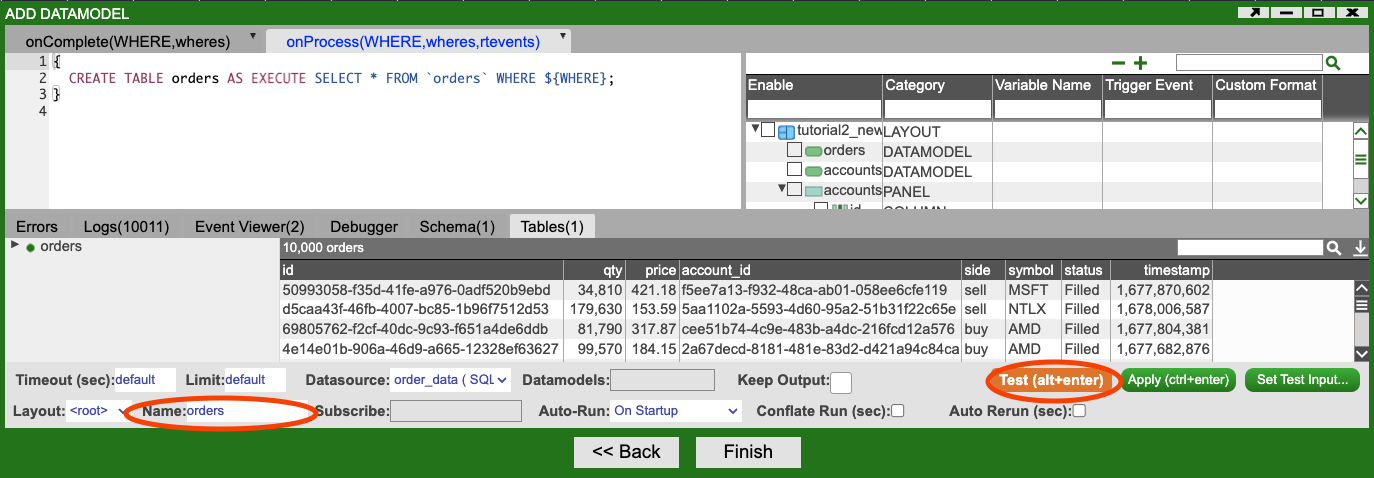
In the Add Datamodel Editor leave all of the settings as they are. This datamodel will be called orders, click the Test button to make sure that the information is being correctly retrieved.
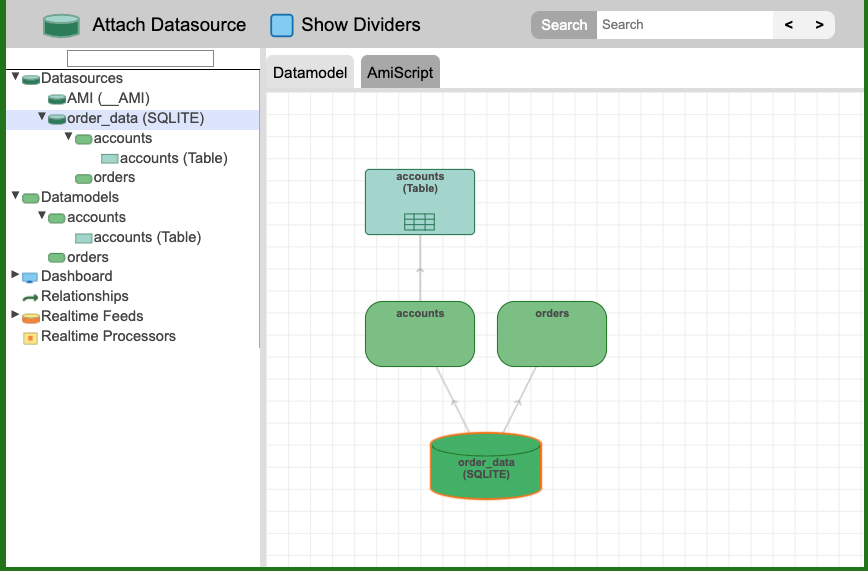
Click the Finish button, the Data Modeler (see Datamodels and Datasource image above) should now show:
- The
datasourcecalledorder_data. - Two
datamodels:accountsorders
- The accounts Table Visualization.
- How data moves between all of the above.
Visualizing Order Data
Up to this point you have only created one window, which displays a Table Visualization of data from the accounts datamodel. You could create another window in which to display data from the orders datamodel but the data is conceptually closely related: orders are made by accounts. Instead you will split the existing Order Explorer window into two with one half showing account data and the other, order data.
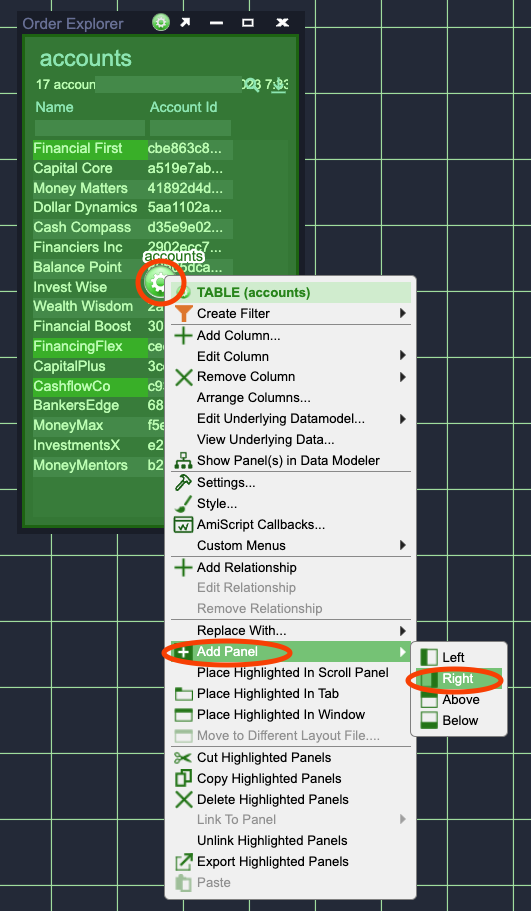
- Click on the green Gear icon in the middle of the Order Explorer window and select:
- Add Panel then
- Right
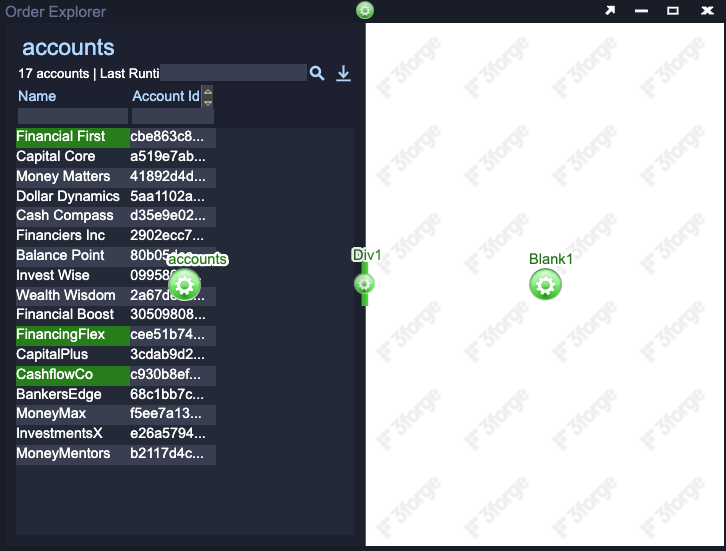
You should now have a window that shows your existing Table Visualization of accounts on the left and blank panel on the right (see Two Panels in One Window image above).
Adding a Tree Grid Visualization
You now have a place to put a visualization of the order data stored in the orders datamodel. You could create a Table Visualization, as you did for the accounts, however there are a lot more orders than accounts. A Tree Grid will allow you to aggregate (collect) orders by one or more fields such as grouping all of the orders for a particular account together.
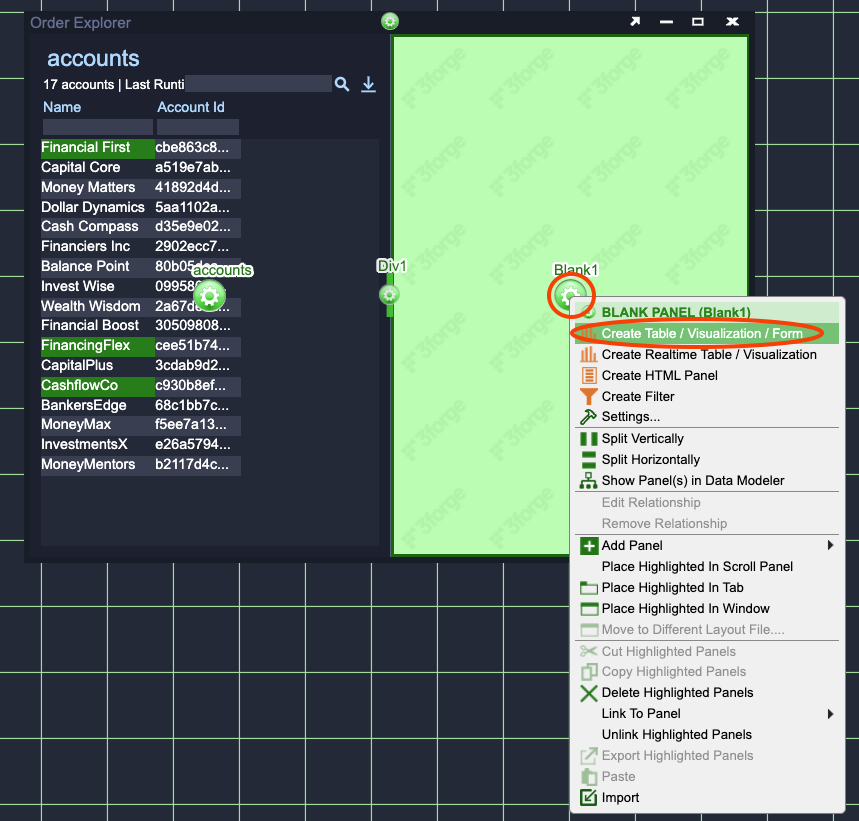
- Click on the green Gear in the center of the new panel on the right of the Order Explorer window.
- Click on Create Table / Visualization / Form.
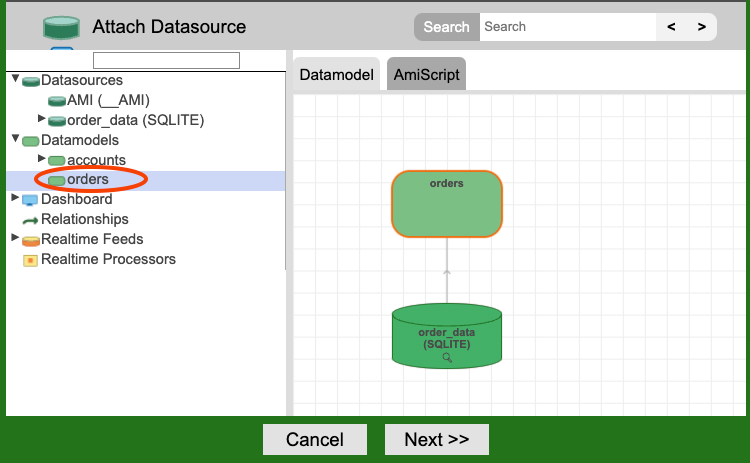
- When the Data Modeler opens:
- Click on the
ordersdata model then - Click on the Next button.
- Click on the
- On the pop-up dialog, press OK to confirm that you want to create a visualization on this datamodel.
- When the Visualization Wizard window opens, choose the Tree Grid option.
- Use the green arrows in the middle of the window to move everything except Account Id, Symbol and Side to the AGGREGATE BY list.
- Select an item on the left by clicking on it.
- Click the green right arrow to move the item to the right.
- If you make a mistake select the item on the right and use the green left arrow to move it to the left.
- Use the arrows on the left to change the order of the GROUP BY list.
- Select an item by left clicking it.
- Use the green up and down arrows / to change its position in the list.
When finished your configuration should look like the image below.
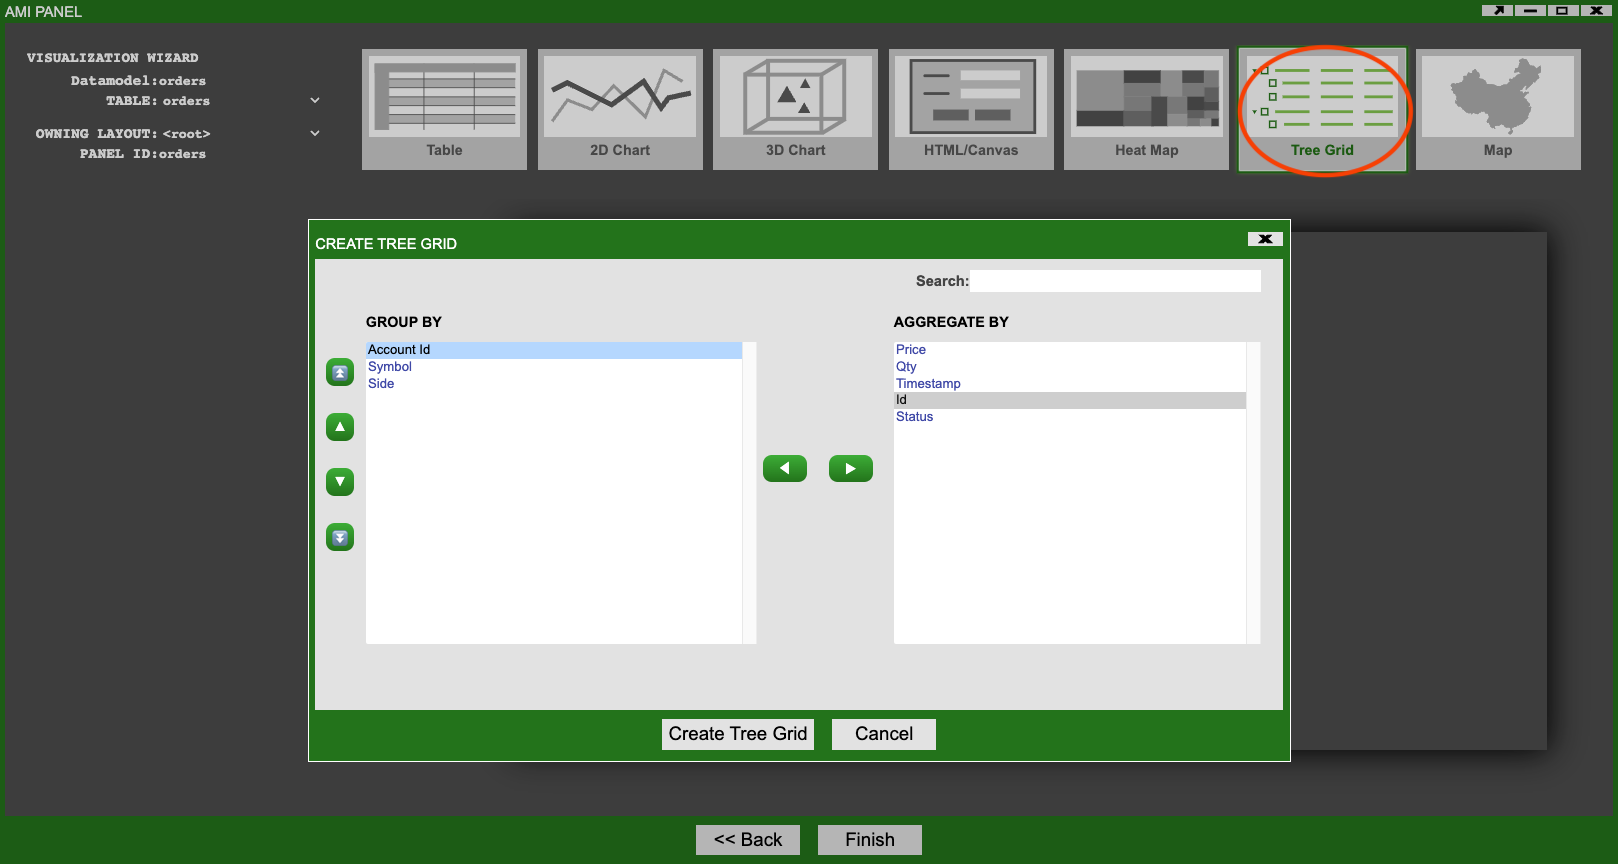
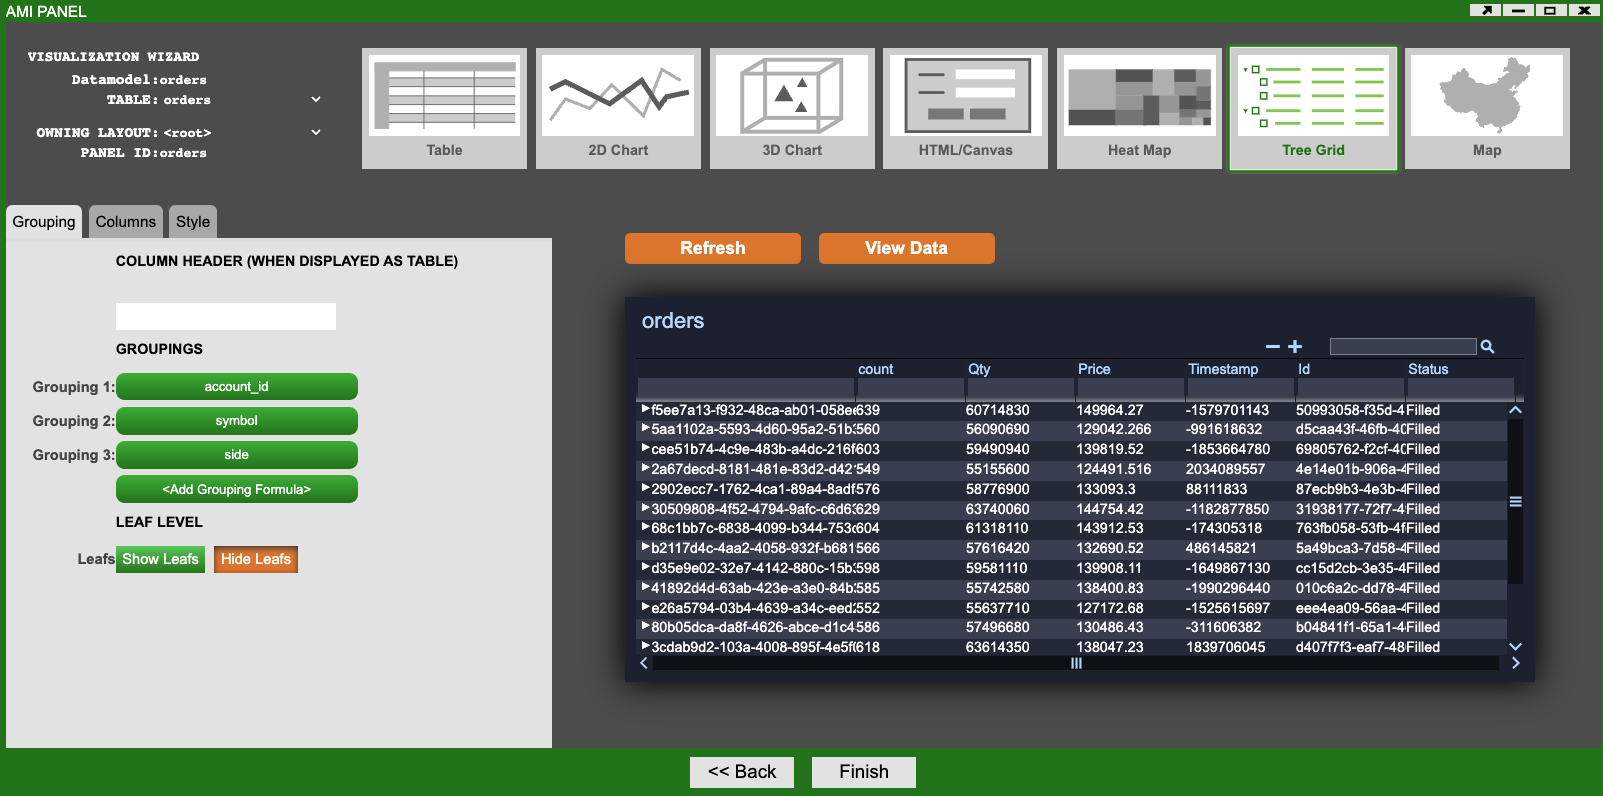
Click on the Create Tree Grid button and you will be shown a preview of the Tree Grid Visualization (see Tree Grid Preview image above).
Here you could change the groupings and enable or disable showing the leafs. By default Hide Leafs is selected which means that you will only see the groupings and not individual orders. Leave Hide Leafs selected as you will be creating another visualization later to view order details.
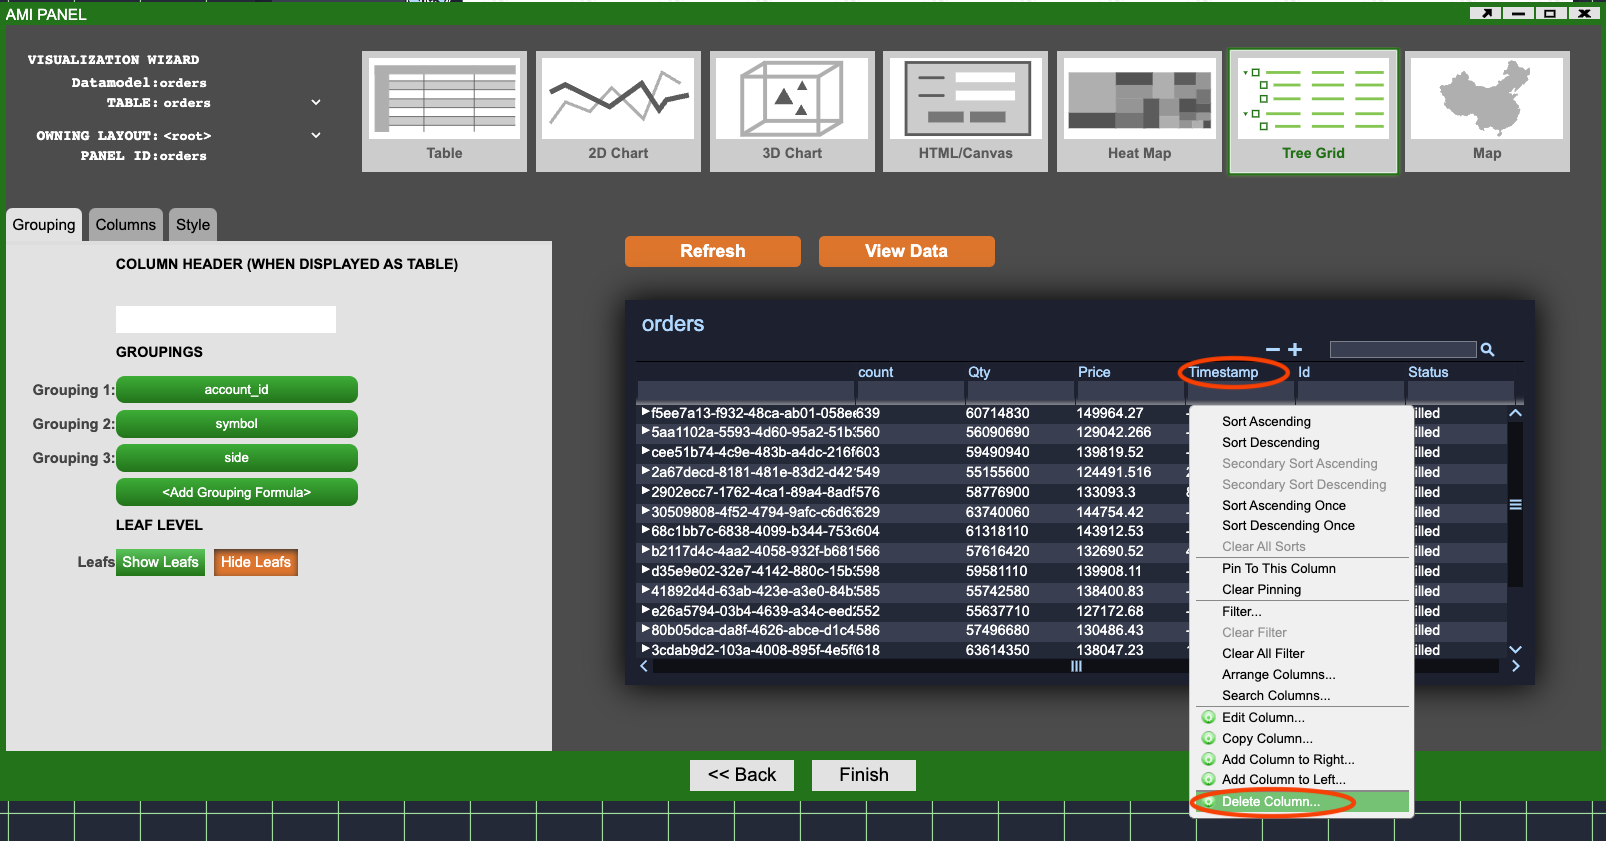
Some of the columns don't really make sense as aggregations: it is hard to aggregate (combine) timestamps, unique IDs and statuses.
- Delete the Timestamp, Id, Status columns by right clicking on them and select Delete Column... (see Tree Grid Delete Column image above).
- Click Finish
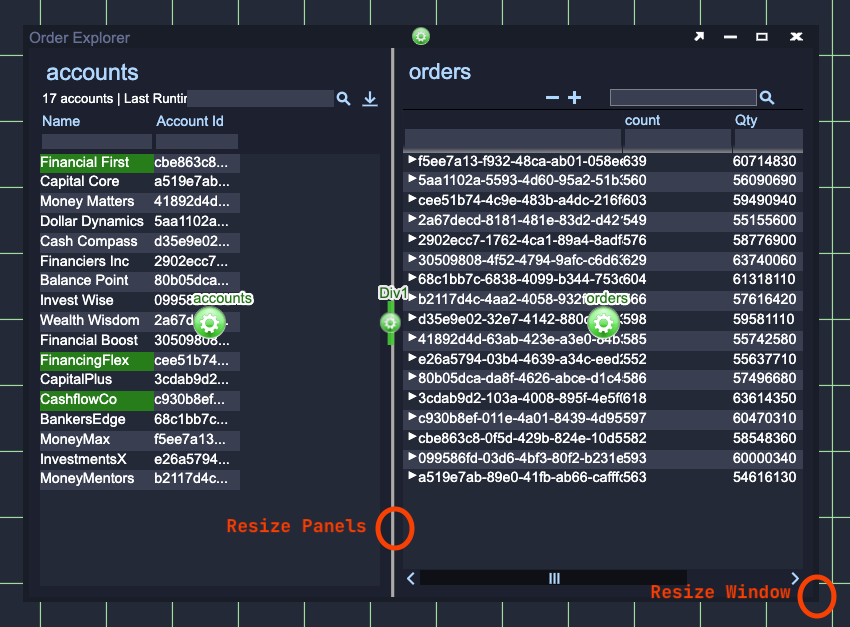
You will now see that the right hand panel of the Order Explorer window has been filled with the Tree Grid Visualization. You may need to resize the window and panels to ensure that you can fully see both visualizations.
- The window can be resized by left clicking on the corner and dragging.
- The panels can be resized by left click on the center divider and dragging.
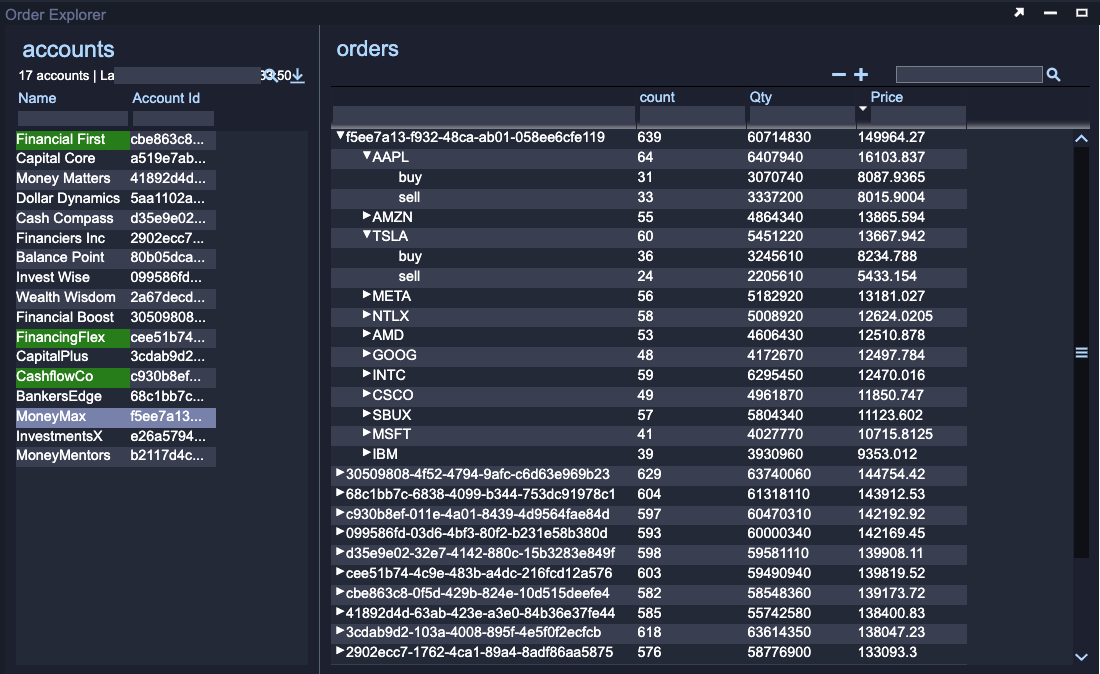
Using the Tree Grid
Enable User Mode.
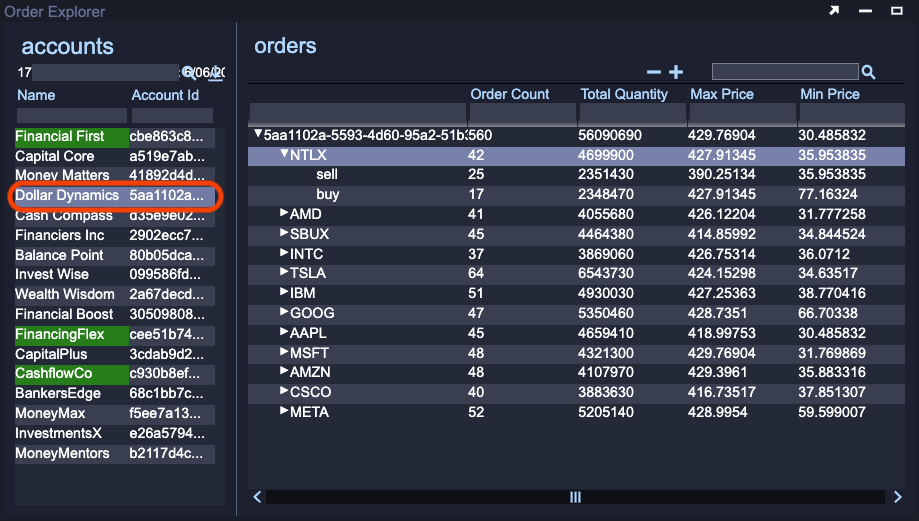
The Tree Grid you have created groups all of the orders retrieved, via the order_data datasource, from the SQLite database. They are grouped first by the Account Id that made the order, then by the Symbol (a unique series of letters assigned to a company's stock) and finally by Side (was the order to buy or sell).
You can expand the tree to any of these groupings and see the value of the aggregations such as the total quantity of TSLA sold by an account. You have yet to configure what the aggregations are, by default they are the sum of all leafs but you will change this later.
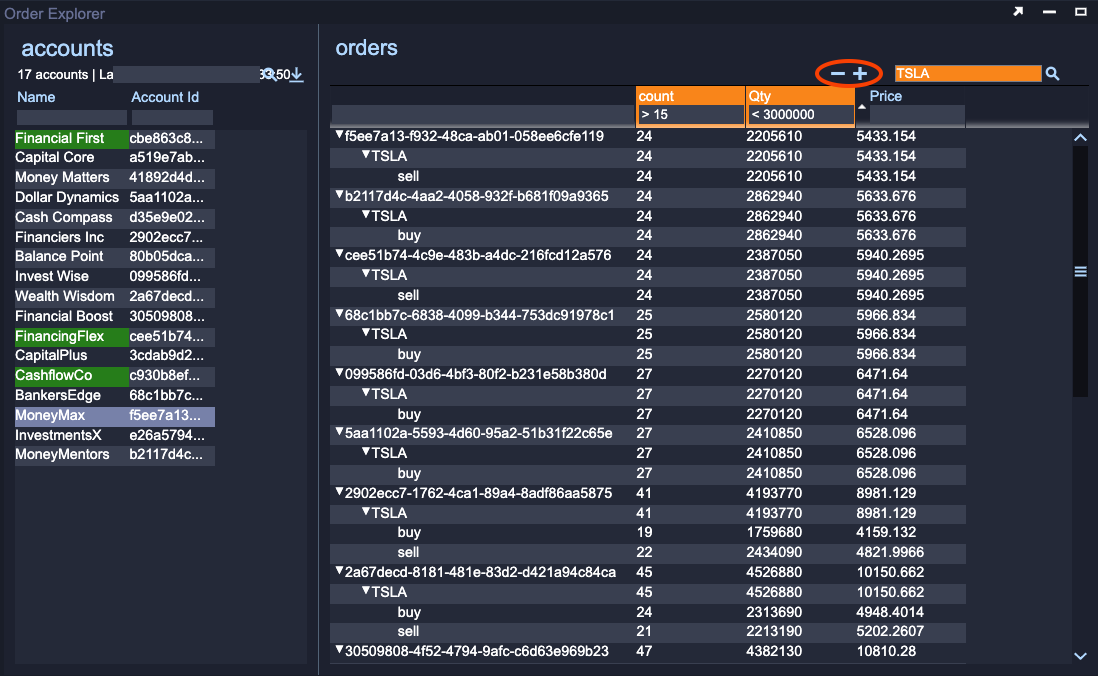
Tree Grids provide largely the same feature set as Table Visualizations.
- All columns can be sorted in ascending or descending order.
- All columns can be searched.
- Non-tree columns can be filtered with wildcard support.
Additionally you can fully collapse or expand the tree using the minus / plus buttons to the left of the search box.
Customizing the Aggregations
Enable to EDIT mode.
You will now make some changes to the Tree Grid Visualization. The column headings are generated automatically from the source of the data and can often be improved. The default aggregation type, to sum all the values, can be changed and additional aggregation columns added.
-
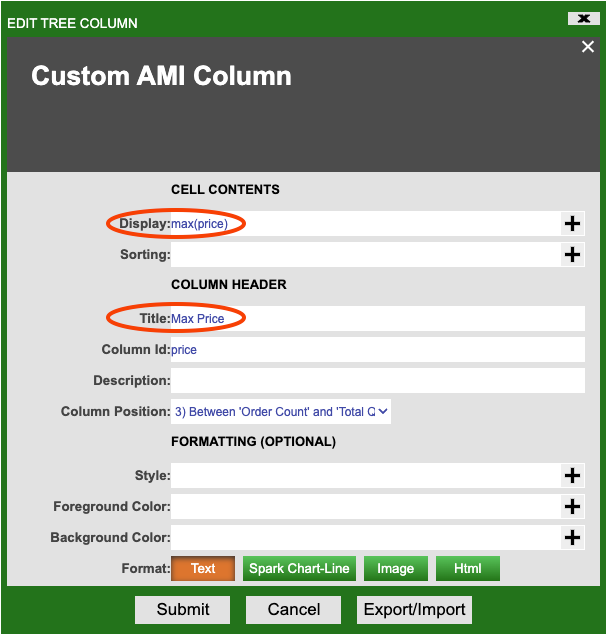
Change the aggregation type and rename the price column.
- Click on the Price column heading and select Edit Column.
- Change the text in the Title field to
Max Price. - Change the Display field to
max(price). This will calculate the maximum price of all orders in the group rather than the sum of prices. - Submit the changes.
-
Rename the count and Qty columns to Order Count and Total Quantity.
- Click on the column heading and select Edit Column.
- Change the text in the Title field.
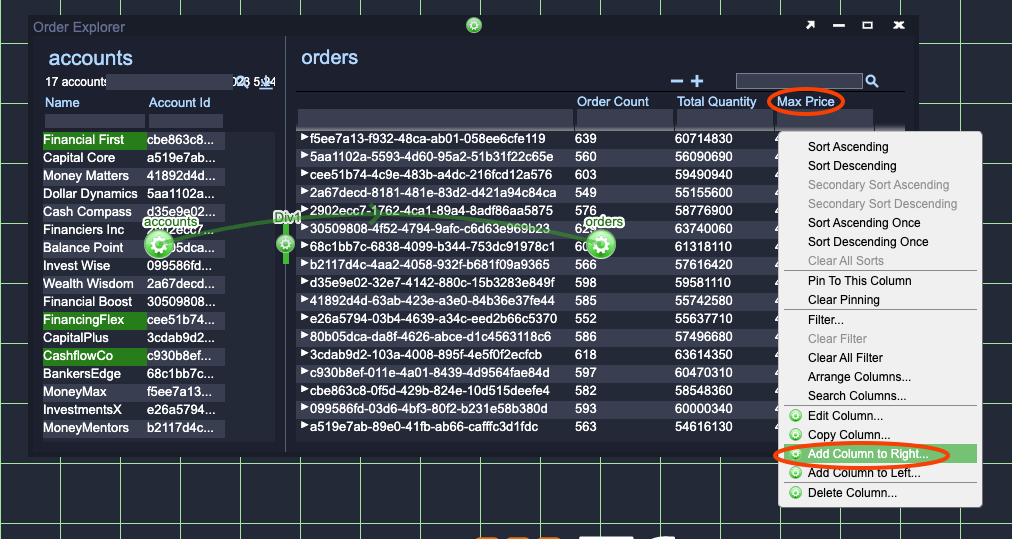
-
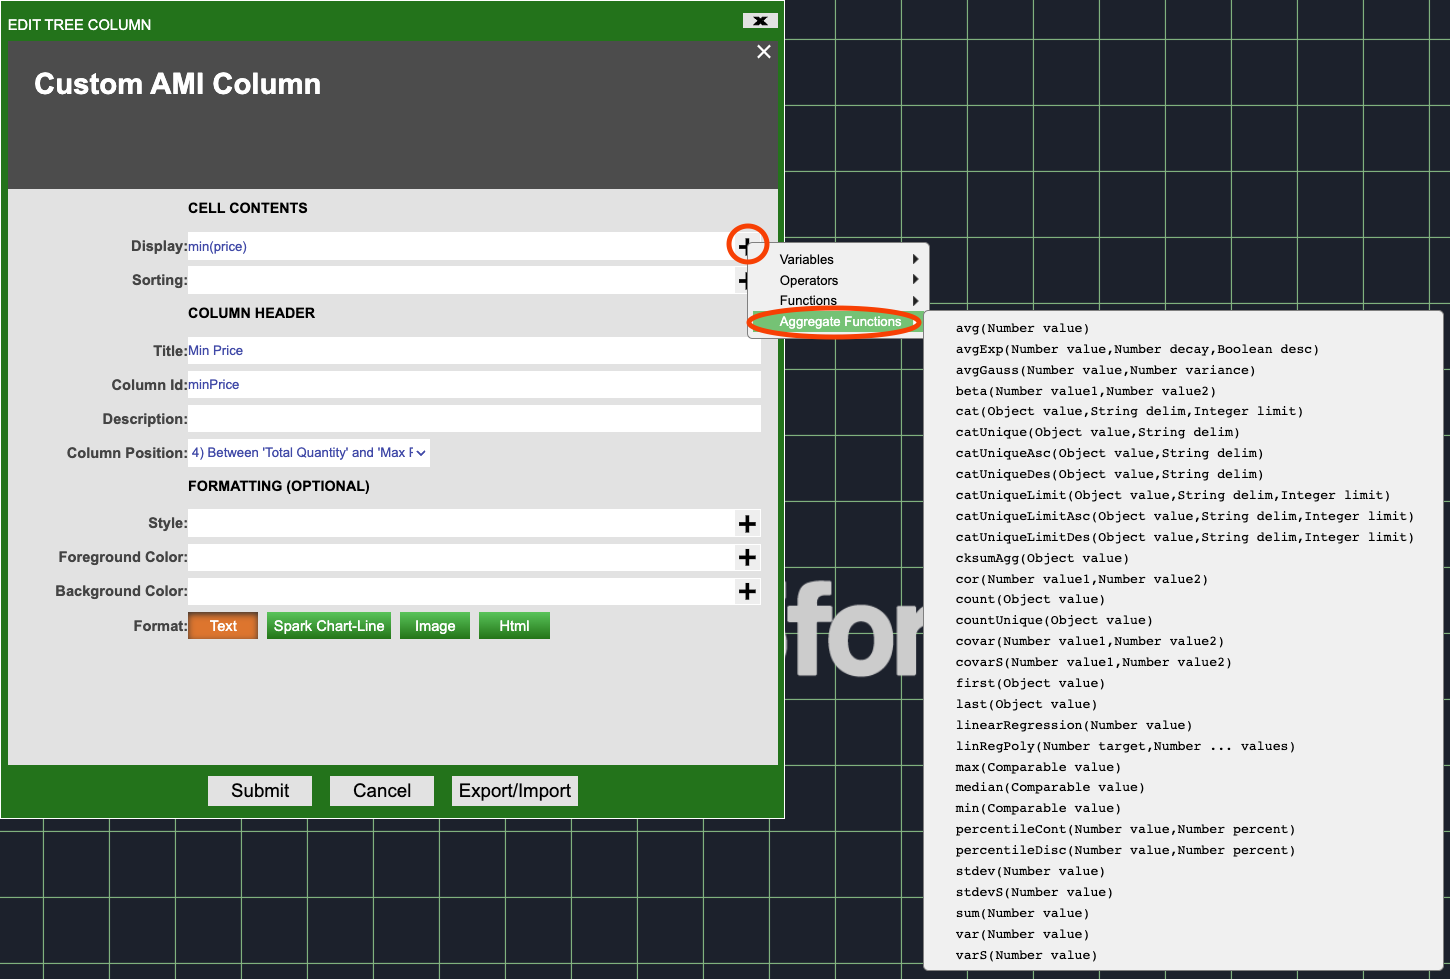
Add a new column that shows the minimum price for all of the groupings.
- Click on the Max Price column heading and select Add Column to Right...
-
In the Add Tree Column window that pops up do the following:
- Set Display to
min(price). - Set Title to
Min Price. - Set ColumnId to
minPrice.
- Set Display to
-
To view the possible aggregation functions click on the Plus to the right of the Display field and select Aggregate Functions.
Info
The accounts Table and orders Tree Grid visualizations already provide a powerful way for a user to drill down into the data in an intuitive way. However, the accounts and orders visualizations are currently disconnected. If you are particularly interested in orders made by Capital Core and Wealth Wisdom you would have to use filters in the orders Tree Grid to filter out these orders.
While this is possible, in the next section you will make use of relationships to simplify this significantly.
Relationships
AMI allows for links or connections to be made between visualizations, these are called Relationships. Relationships allow for the selections made in one visualization to influence another visualization. This could be selecting:
- Rows in a Table Visualization.
- Groups in a Tree Grid Visualization.
- Points in a Chart Visualization.
- Locations on a Map Visualization.
- and more...
Information on what you have selected will be stored in a variable (by default the WHERE variable) and used by datamodels when retrieving data from datasources.
Variables
A variable is a named bit of storage. The name stays the same but the contents of the variable can change (vary). You can use the name of the variable to access the contents. This is very useful when you want to record a piece of information and access it again later.
Variables in AMI are typed: when they are defined (created) you must also define what type of data will be stored in the variable. The WHERE variable referenced above is already defined for you and is a String type variable. It can hold strings of characters (such as words or sentences) such as "this is a string". You will be introduced to some different types in later tutorials.
You will now create a relationship between the accounts Table Visualization and orders Tree Grid Visualization. This will allow a user to filter the orders shown in the Tree Grid by selecting accounts in the accounts Table.
Adding a Relationship
Enter Editor mode.
Click on the green Gear in the center of the orders Tree Grid Visualization and select Add Relationship.
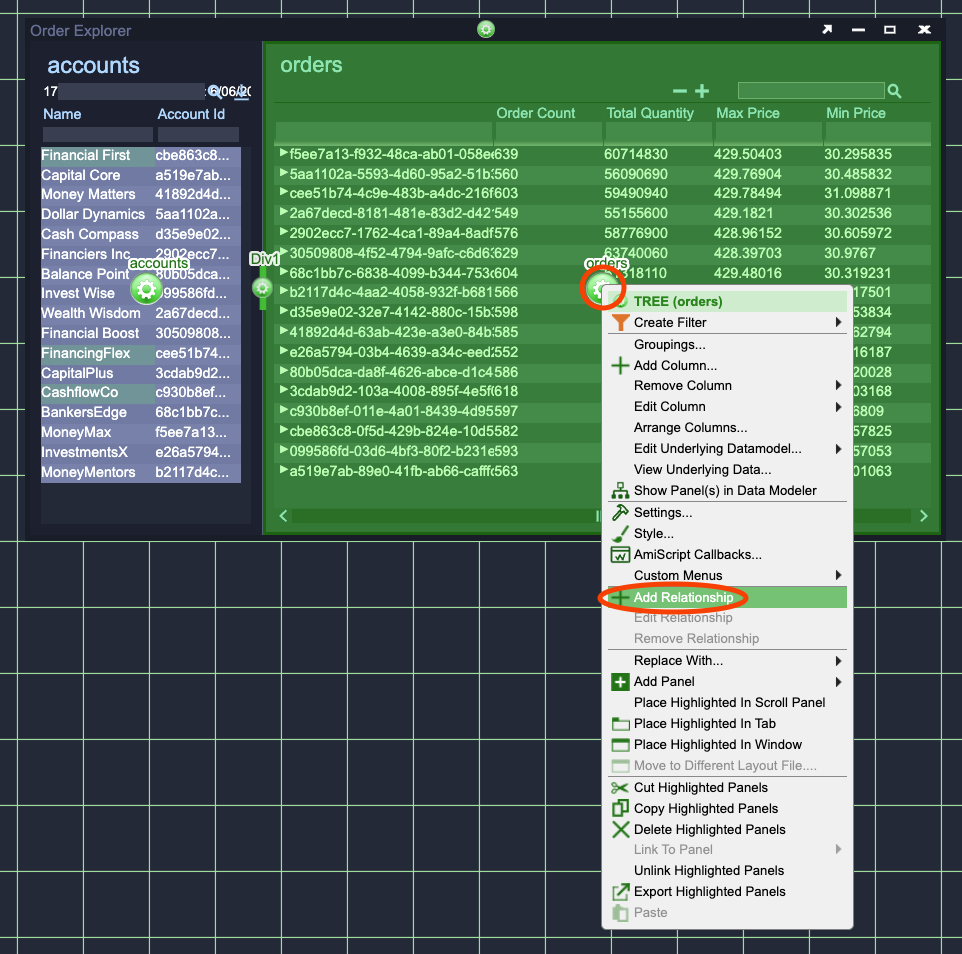
![]()
A grey arrow will appear starting from your mouse cursor and going to the green Gear in the center of the orders Tree Grid (see Grey Arrow image above).
Left click on the green Gear in the center of the accounts Table Visualization.
- The arrow should turn green and connect from the accounts Table Visualization to the orders Tree Grid Visualization.
- The Edit Relationship window will open.
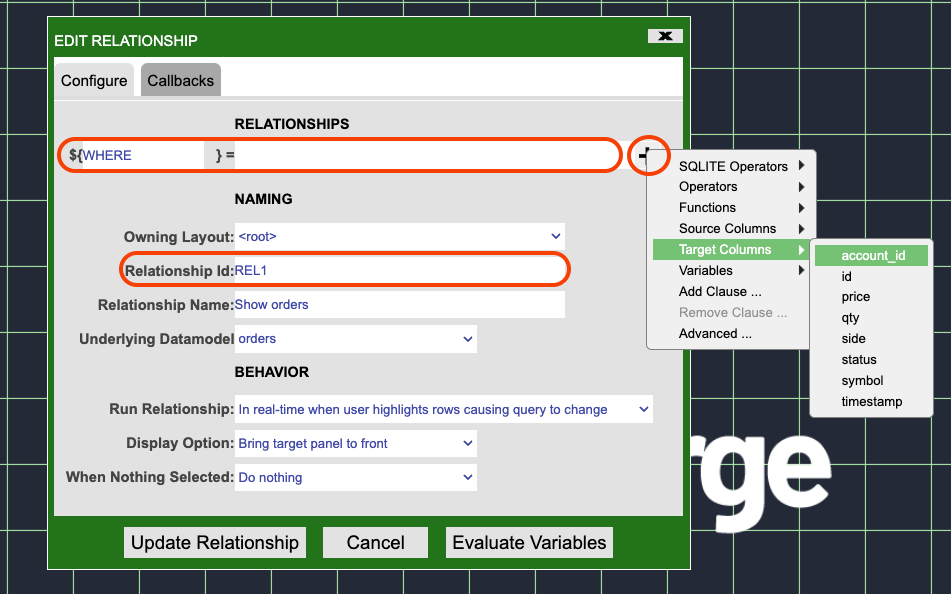
There are many options here that you could configure, to change how the relationship behaves, but for now you will focus on the relationship definition and id.
- Change the Relationship Id to
accounts_to_ordersso that it is clear what the relationship defines. - In the = box at the top of the window enter the following:
- You can either type this in or enter it using the Plus menu on the right.
- Target Columns then account_id
- SQLITE Operators then =
- Source Columns then id
- You can either type this in or enter it using the Plus menu on the right.
This is defining a String that will be constructed based on the row(s) selected in the accounts Table Visualization. This String will be stored in the variable defined on the left, in this case the WHERE variable.
Info
This WHERE variable will be used by the orders datamodel to only retrieve order data (from the SQLite database) whose account_id matches what was selected in the accounts Table Visualization.
Evaluate Variables
Before you finish adding the relationship you should test whether the WHERE variable is being correctly set.
Click on the Evaluate Variables button.
The Relationship Values window will open and should look like one of the images below (the long combination of letters/numbers may be different). Which one it will look like depends on what you have selected in the accounts table.
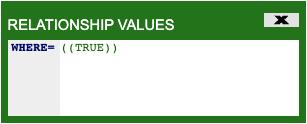
WHERE=((TRUE))
If the Relationship Values window shows:
- Close the Relationship Values window by clicking on the cross in the upper right corner.
- Move the Edit Relationship window, by clicking on the green bar at the top of the window and dragging to one side, so that you can see the accounts Table Visualization.
- Click on one of the accounts in the Table Visualization, for example 'Financial First'.
- Click on the Evaluate Variables button again.
While this process is optional it does allow you to verify that the relationship is correctly formed: the WHERE variable contains the Account Id(s) from the selected account(s).
Click Update Relationship.
How Relationships Work
You can see where the WHERE variable, you defined in the previous section, is used in retrieving data for the orders datamodel in the image below.
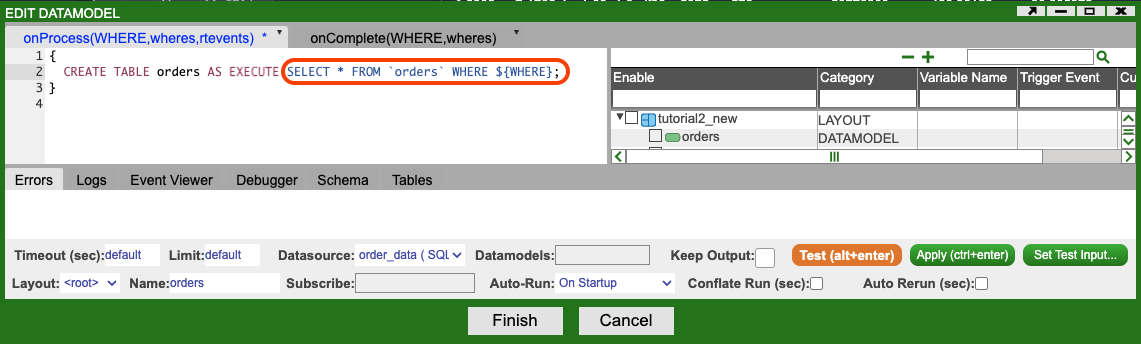
${WHERE}, is the WHERE variable being used.
- The dollar sign and curly braces are the format for what is called String Substitution in AMI. The contents of the variable will be substituted in place of the variable. 1
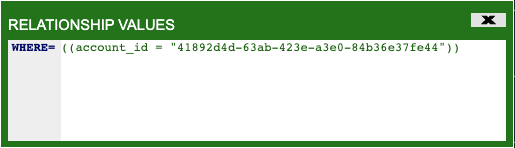
- If the
WHEREvariable contained the String((account_id = "41892d4d-63ab-423e-a3e0-84b36e37fe44"))once String substitution has been carried out the execute statement will look as follows:
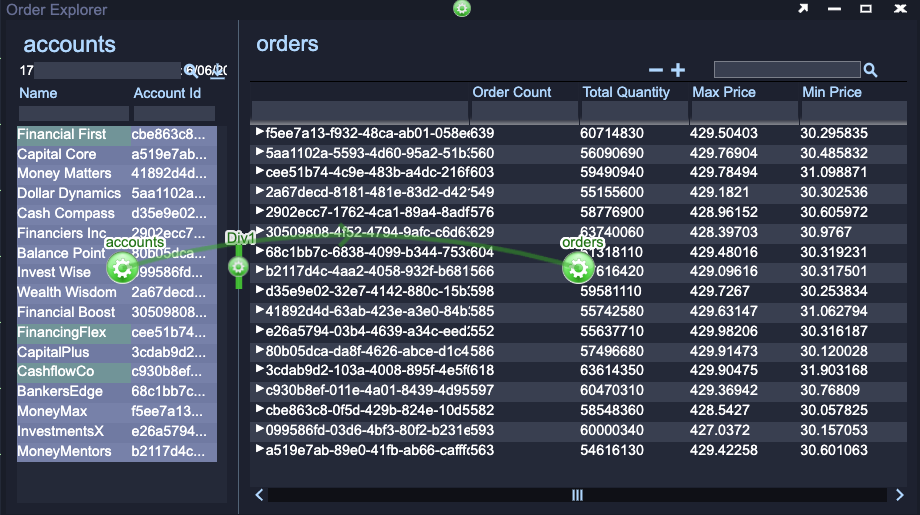
Using the Connected Visualizations
Enter USER mode.
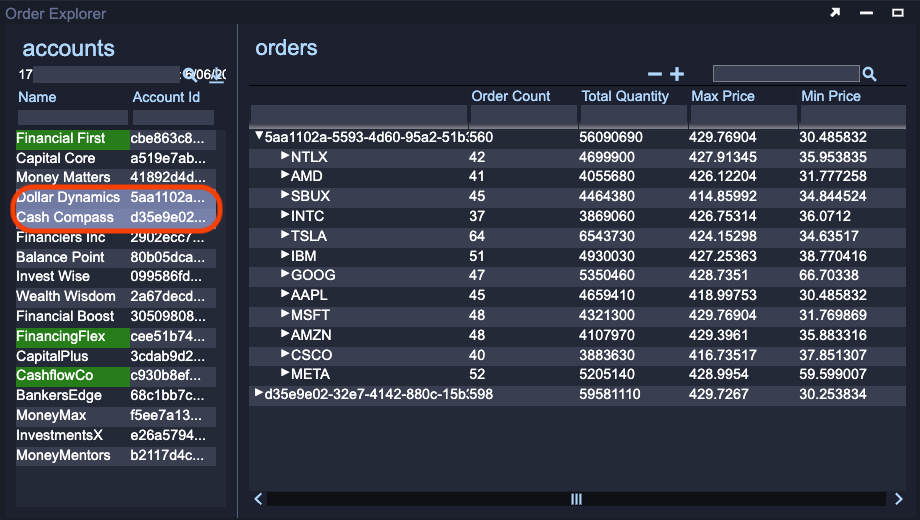
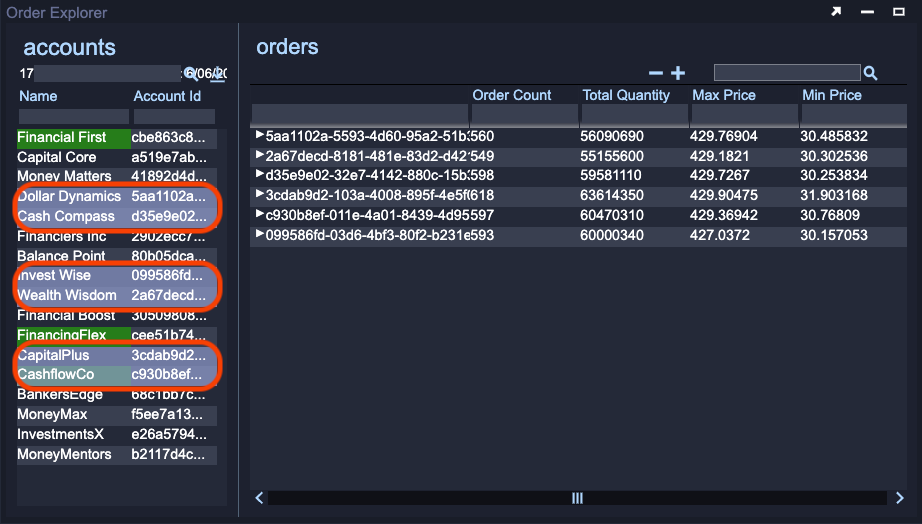
You should now test out the relationship by select one or more accounts in the accounts Table Visualization. You should see the orders Tree Grid update with aggregations for the accounts you selected. You can select:
- Individual accounts by left clicking on it.
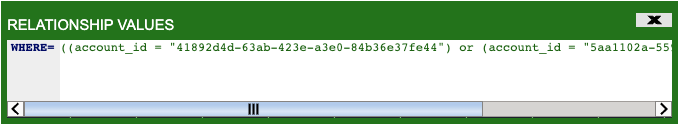
- Contiguous Range of accounts by left clicking on the first account, holding the Shift key and left clicking on the last account in the range.
- Non Contiguous Range of accounts by holding the Ctrl key and left clicking on each account you want to include.
You can interact with the data in the orders Tree Grid Visualization in the all of the same ways described in Using the Tree Grid section.
Next Tutorial
In the next tutorial you will add another Table Visualization and relationship allowing you to practice what you have learnt in this tutorial. You will also make use of AMI Script for further customization, configure a timestamp field and use a JOIN clause to enhance the data retrieved from a single SQLite table.