Getting Started 3
In this tutorial you will create a new Table Visualization showing order details which will be linked to the existing Tree Grid Visualization using a relationship. The Table Visualization will make use of a datamodel that retrieves data from another datamodel rather than a datasource. Once this new Visualization is set up you will customize it: using AMI Script to configure its appearance and behavior. This will include dealing with timestamp data Finally you will enhance the Tree Grid Visualization by modifying its datamodel to make use of a JOIN SQL clause. This tutorial will allow you to practice what you have learnt in the first two tutorials.
Tutorial Objectives
In this tutorial you will
- Practice skills and and techniques learnt in previous tutorials.
- Create a
datamodelthat retrieves data from anotherdatamodel. - Create a new Table Visualization for order data details.
- Link two visualizations using a
relationship. - Make further use of
AMI Scriptfor customization. - Introduce more advanced SQL statements using the
JOINclause.
Videos
End Product
The video below showcases the result of this tutorial.
Follow Along
Order Details
Your application currently lets you select accounts and see aggregated data on the orders placed by these accounts. However, the aggregated order data does not show individual orders. You will now create another Table Visualization (and associated datamodel and relationship), to show individual order data for aggregations selected in the Tree View Visualization. This process has been covered in the previous tutorial and so will be described in a little less detail here. Refer to the previous content for more in-depth descriptions and images.
Create Order Details Datamodel (Blender)
Basing a datamodel on a datamodel
In this section you will be creating a new order_details datamodel that retrieves its data from the existing orders datamodel rather than from the SQLite database via the datasource. You are being asked to do this in part to show that it is possible. This particular application would work just as well if you were to retrieve the order data from the datasource.
One of the strengths of AMI is that the data used in the application can be held and managed externally (such as in an SQLite database). Only the information required is retrieved by AMI. In some situations querying (retrieving a subset of data) a datasource containing a very large amount of data can be slow or create enough load that others are impacted.
If the data you need has already been retrieved from the datasource and stored in a datamodel it can be a good idea to make use of that in other datamodels. In this case the orders datamodel has already retrieved order data to be used in the Tree Grid Visualization. The order details (individual orders from a Group selected in the Tree Grid Visualization) are just a subset of these data.
-
Open the Data Modeler.
- Right click on the
ordersdatamodel(not thedatasource) and choose Add Datamodel.
- Right click on the
-
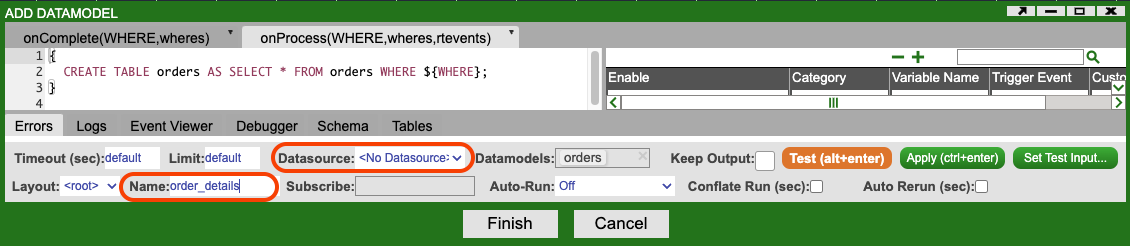
Change the name of the
datamodelto order_details and click the Test button.- You may notice that the syntax of the AMI Script used to create the table in the
datamodelis slightly different to that used when retrieving data from adatasource. - Notice that the Datasource field has the value
<No Datasource>.
- You may notice that the syntax of the AMI Script used to create the table in the
-
Test the
datamodelby clicking on the Test button. -
Click Finish.
-
Close the Data Modeler.
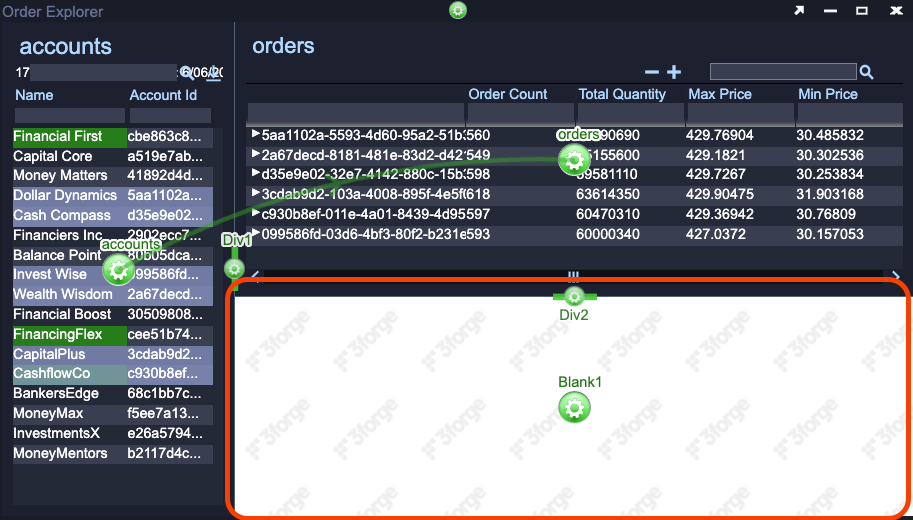
Add a Table Visualization
-
Add a panel below the orders Tree Grid Visualization.
- Click on the green Gear in the center of the Tree Grid Visualization.
- Select Add Panel.
- Select Below.
-
Add a Table Visualization to the new panel.
- Click on the green Gear in the center of the new panel.
- Select Create Table / Visualization / Form.
-
Configure the Table Visualization.
- When the Data Modeler opens, select the
order_detailsdatamodel(shows as a trapezoid rather than a rectangle) and click Next. - Confirm that you want to create a visualization on this datamodel.
- Select Table in the Visualization Wizard window.
- Click Finish.
- When the Data Modeler opens, select the
-
Rename the new panel.
- Double click on the title, orders, in the upper left corner of the new panel.
- In the pop-up window rename it to
order details.
Info
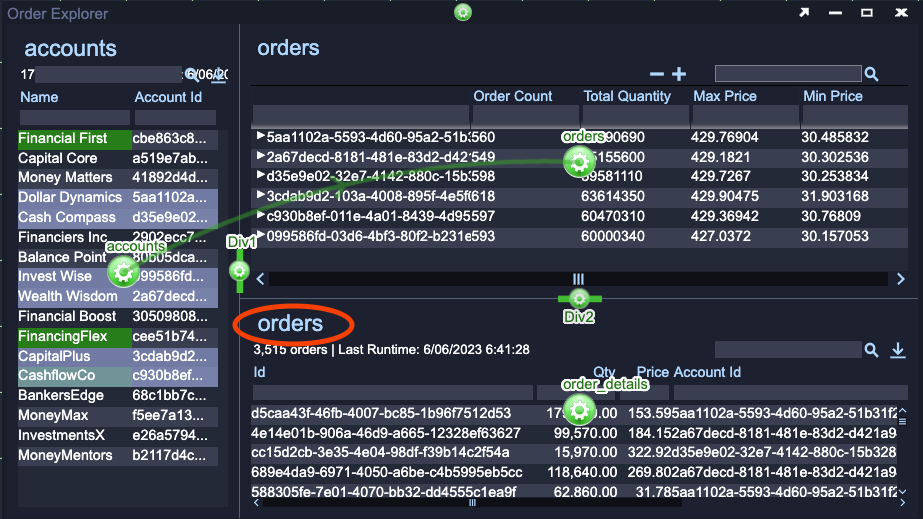
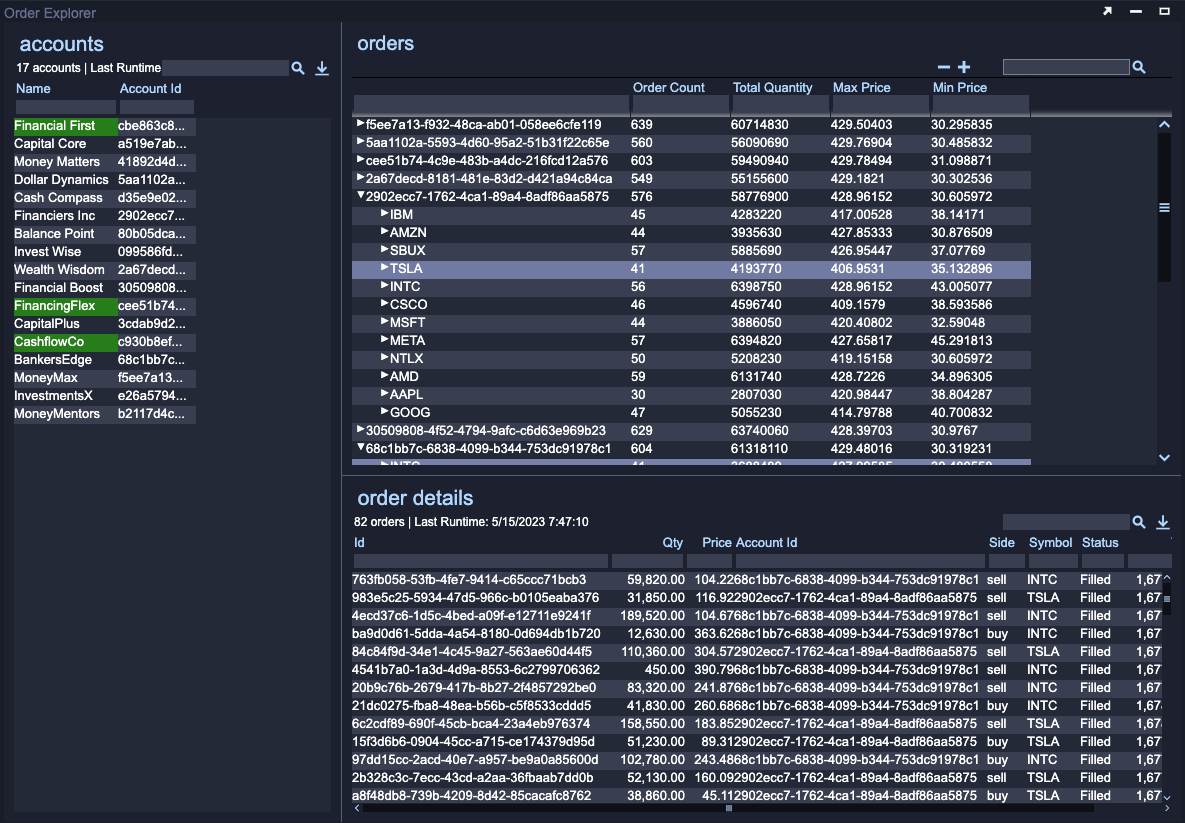
Even though you have not yet created a relationship between the orders Tree Grid Visualization and the new order details Table Visualization you get some useful behaviour. Try selecting different accounts in the accounts Table Visualization. You should notice that both the orders and order details Visualizations both update.
- The Tree Grid Visualization as the top show aggregated data on the orders belonging to the selected account(s).
- The Table Visualization at the bottom shows the individual orders belonging to the selected account(s).
This happens because both visualizations are using, essentially, the same data. The orders datamodel retrieves data from the datasource based on the selected account. The order details datamodel retrieves data from the orders datamodel.
Add a Relationship
You will now create a relationship between the two order visualizations. This relationship will allow a user to select Account Id and Symbol combinations and see the order details for those groups.
Click on the green Gear in the middle of the order details Table Visualization.
- Select Add Relationship. A grey arrow will connect your mouse cursor to the green Gear .
- Click on the green Gear in the middle of the orders Tree Grid Visualization.
-
In the Edit Relationship window that pops up put the following AMI Script in the = field.
-
Rename the relationship by putting
orders_to_order_detailsin Relationship Id field.
Equals but Different
You may have noticed that the AMI Script above uses a double equals sign, ==, rather than the single equals sign used for the relationship between the accounts and orders visualizations. Recall that this String will be stored in the WHERE variable and then used when creating the relevant datamodel.
- The first relationship defined how the
ordersdatamodelretrieved data from the SQLite database, via adatasource. In this case the contents of theWHEREvariable would be interpreted (processed) by SQLite which uses a single equals sign to check for equality. - The relationship you have just added defines how the
order_detailsdatamodelretrieves data from theordersdatamodel. The contents of theWHEREvariable would be interpreted by AMI which uses two equals signs to check for equality.
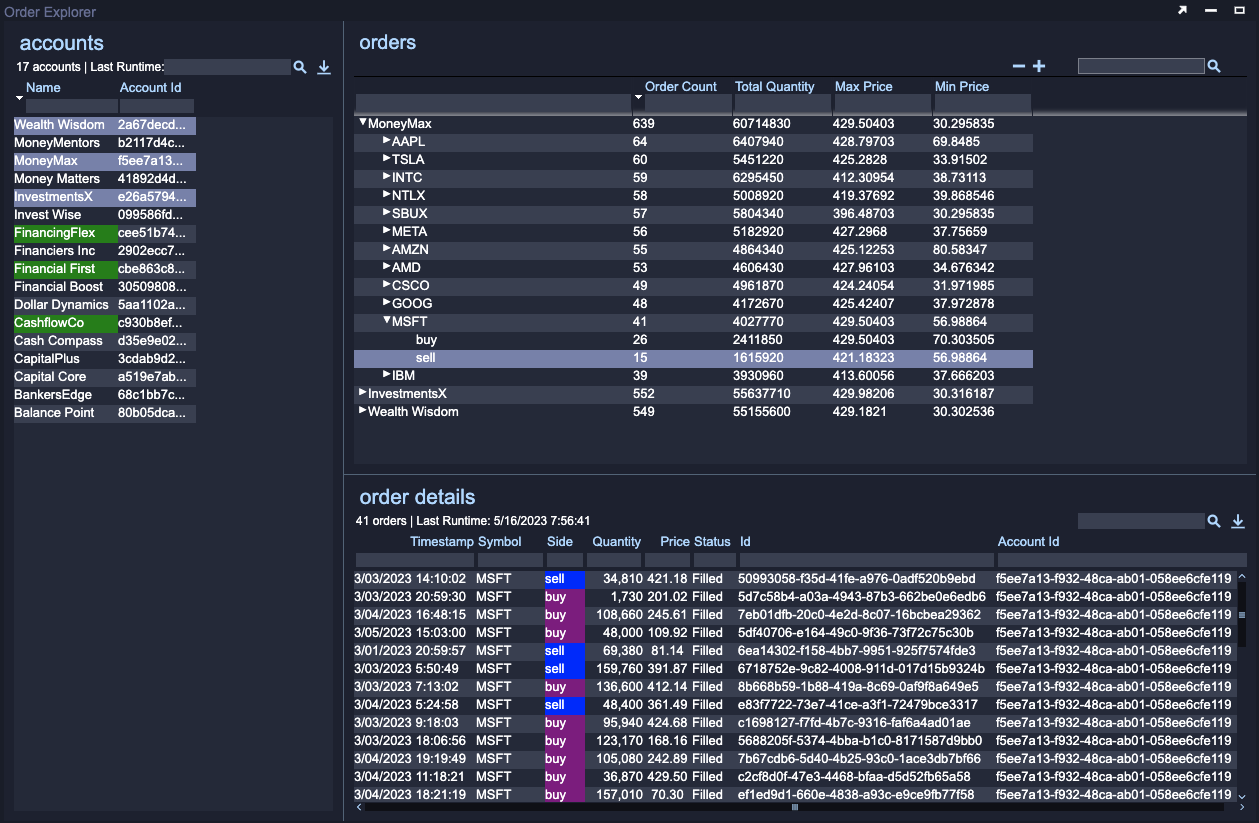
You can now select combinations of Account Id and Symbol in the orders Tree Grid Visualization and see the details for all matching orders in the order details Table Visualization.
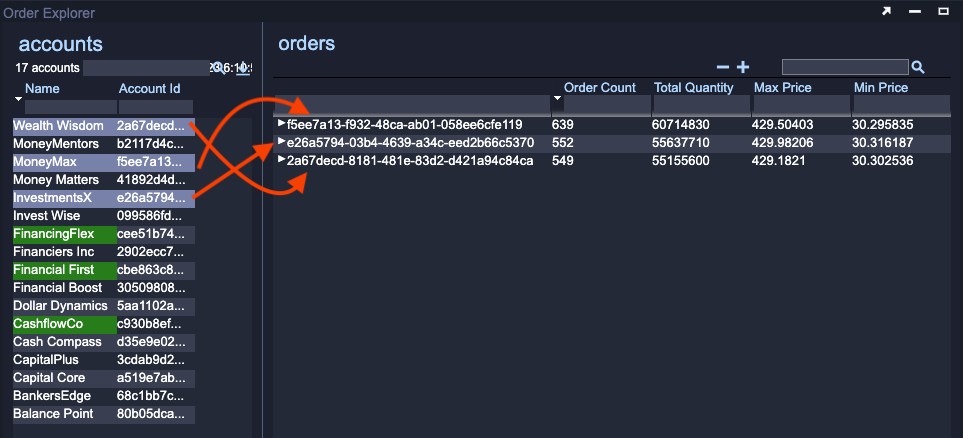
The image below shows a variety of features previously mentioned, combined with the relationships created to filter out specific orders.
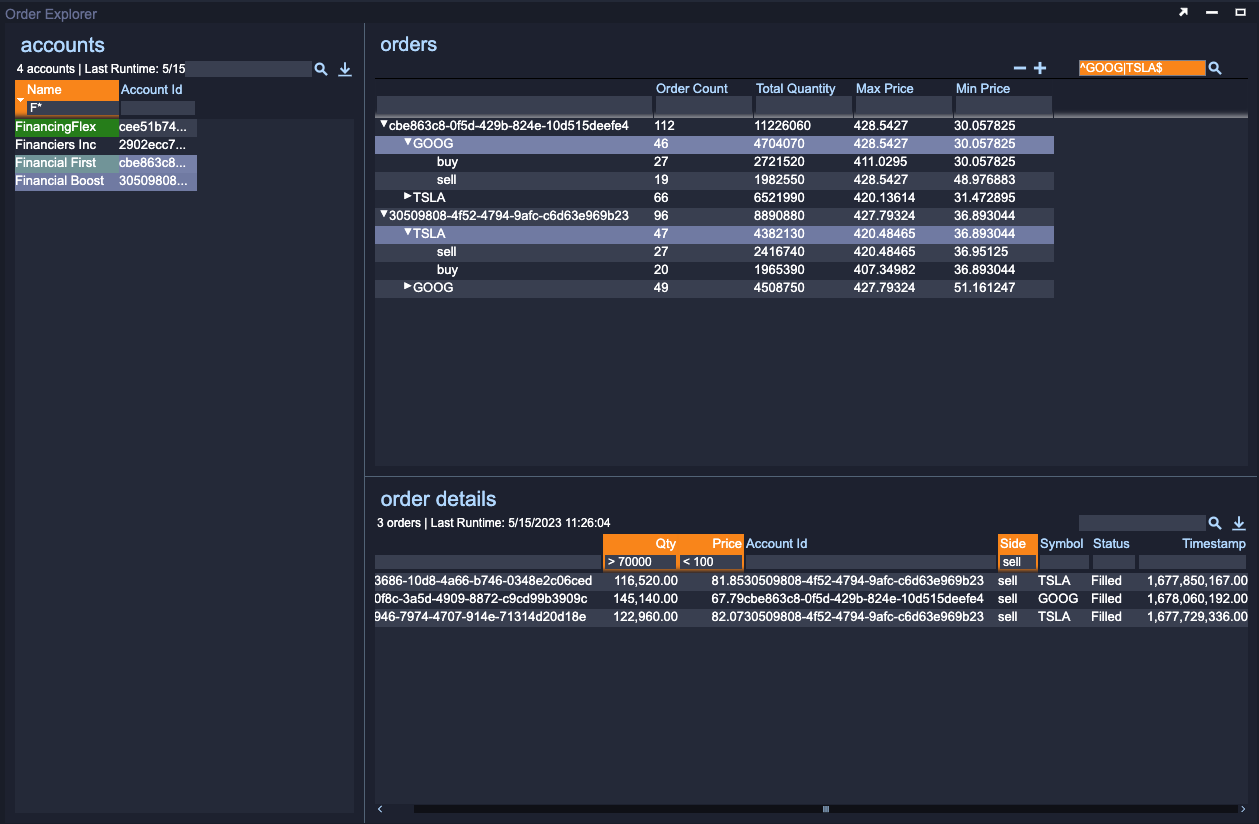
- Filtering is used to find all accounts whose names begin with
F. - Two accounts, Financial First and Financial Boost, are selected which populates the orders Tree Grid with aggregated and grouped orders for these two accounts.
- A regular expression search term,
^GOOG|TSLA$is used to filter the Tree Grid data for the symbolsGOOGorTSLA. - The
GOOGsymbol is chosen for one account andTSLAfor the other account. The order details Table shows data that matches these selections. - The order details are filtered to only show orders whose quantity is greater that 70,000, price is less than 100 and are sell side.
Customizing the Order Details Table
Even small changes to the presentation of data can make a large difference when using the application. In AMI this process can be very fast.
Reorganise columns in the order details Table Visualization, by clicking on the column headings and dragging to a new position, to the following:
- Timestamp, Symbol, Side, Qty, Price, Status, Id, Account Id
Edit the Qty column:
- Change its name to
Quantityusing the Title field. - Remove the extra decimal places by ticking the Decimal Override checkbox and setting the slider to
0.
To make the buy and sell orders visually different use AMI Script to change the background color; use purple for buy orders and blue for sell orders. Check the end of the first tutorial for detailed instructions.
The data in the Price column sticks to the right hand side of the cell making it a little hard to read. Center it by editing the column and setting the Style field to "center".
Timestamps
The data in the Timestamp column is a timestamp, the number of seconds that have elapsed since a fixed point in time. The number on its own is fairly meaningless so you should convert it into a Date and Time. Edit the Timestamp column and:
- Change the Format field to
Date & Time w/ seconds. - AMI's built-in time and date tools want timestamps to be in milliseconds however value retrieved from the SQLite database is in seconds.
- You need to convert the value to seconds by multiplying the timestamp by 1000. The resulting number is so large that it cannot be stored in an Integer so first you will need to cast (convert) the timestamp to a Long (type of variable that can hold larger values).
- Put the AMI Script above in the Display field.
- Change the Style field to
"left"to ensure the Timestamp is easy to read.
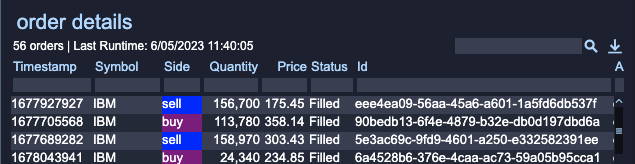
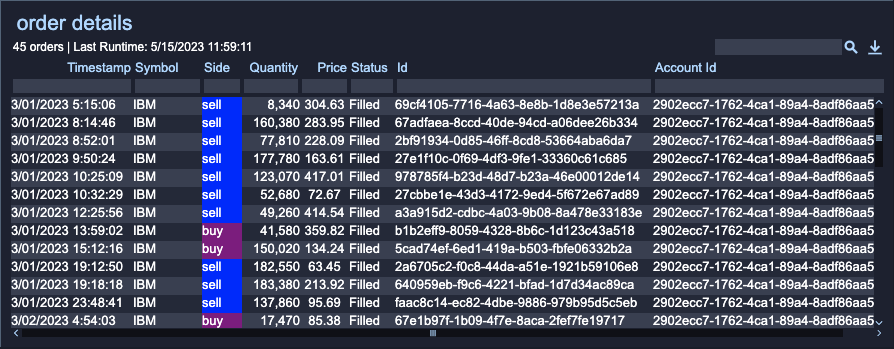
The result of the above changes should look like the image below.
Using a JOIN Clause
There are many further refinements you could make to the existing visualizations by adding more AMI Script or using the built in configuration options. You will now make one last change that requires changing some of the retrieved data itself.
Currently, the Tree Grid Visualization groups orders first by Account Id, based on the selection made in the accounts Table Visualization.
Even with only three accounts selected it becomes difficult to mentally map each Account Id to the related Account Name. The data held on each order only includes the id of the account that made the order not the name of the account. As a result the account name is not available to use in the Tree Grid Visualization.
The solution to this requires you to change the data model.
Open the orders datamodel either by:
- Finding it in the Data Modeler or
- Right clicking on the green Gear in the middle of the order Tree Grid Visualization, selecting Edit Underlying Datamodel... and finally selecting orders.
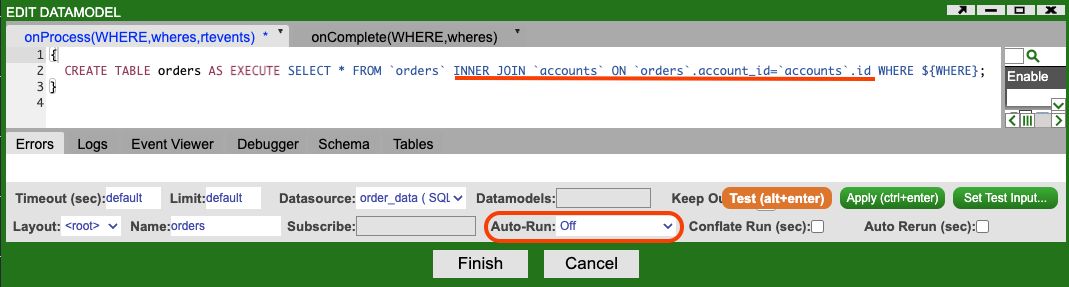
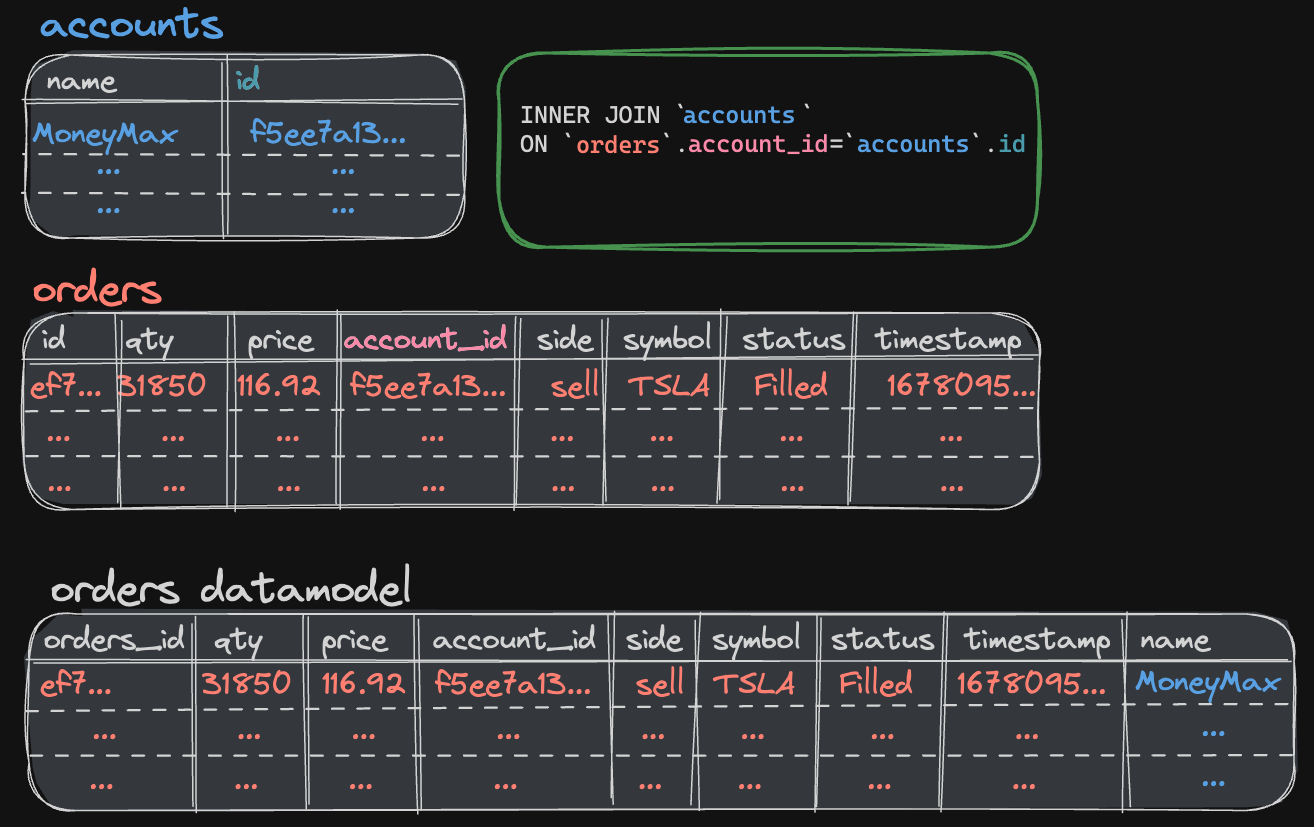
Update the AMI Script used to create the orders table by inserting the following JOIN clause between `orders` and WHERE:
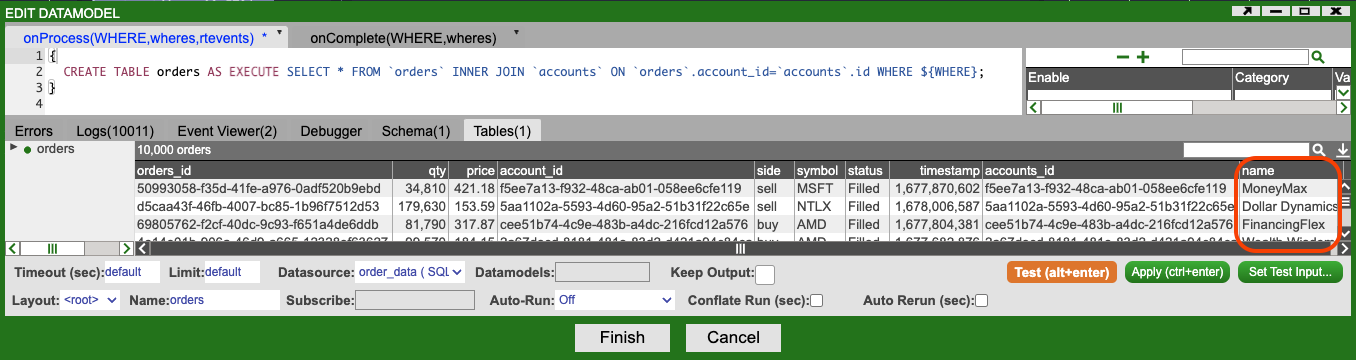
The result is shown in the image below:
This tutorial does not cover the details of JOIN clause. Everything to the right of the EXECUTE statement is SQL that will be sent to the SQLite database to be processed.
- If you are familiar with SQL this means that you can write native SQL queries to construct AMI
datamodels. - If you are unfamiliar with SQL there are resources available outside of these tutorials that can be used to learn more about SQL and the
JOINclause. These tutorials assume no knowledge of SQL.
Info
This new SQL statements joins the data from the orders and accounts tables in the SQLite database. It does this by comparing the account_id column in the orders table to the id column in the account table. This dataset has been designed to ensure that there will always be a match.
The result of the JOIN clause is that the orders datamodel now contains information on the Account Name related to each order (See the JOIN clause data image above).
Don't AutoRun
While you are making changes to the orders datamodel set the Auto-Run field to Off. This field controls when the datamodel will be automatically run (and therefore when data will be retrieved) and defaults to On Startup. In some situations On Startup is appropriate but it is worth considering that if a large quantity of data needs to be loaded, application startup will be slowed.
For this application the orders datamodel should only run when one or more accounts are selected in the accounts Table Visualization. On startup none are selected and so the datamodel should not run.
Updating the Tree Grid Visualization
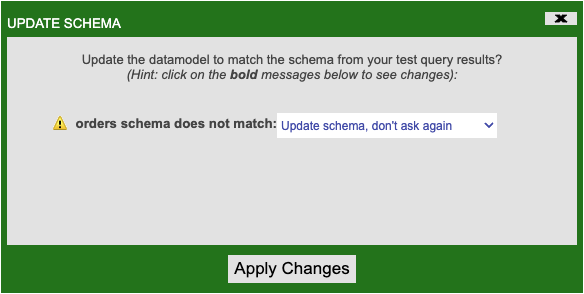
Save the changes made to the orders datamodel by clicking the Finish button. If you are asked if you wish to update the datamodel to match the schema from your test query results, click Apply Changes.
You now need to update the Tree Grid Visualization to make use of the newly available Account Name data.
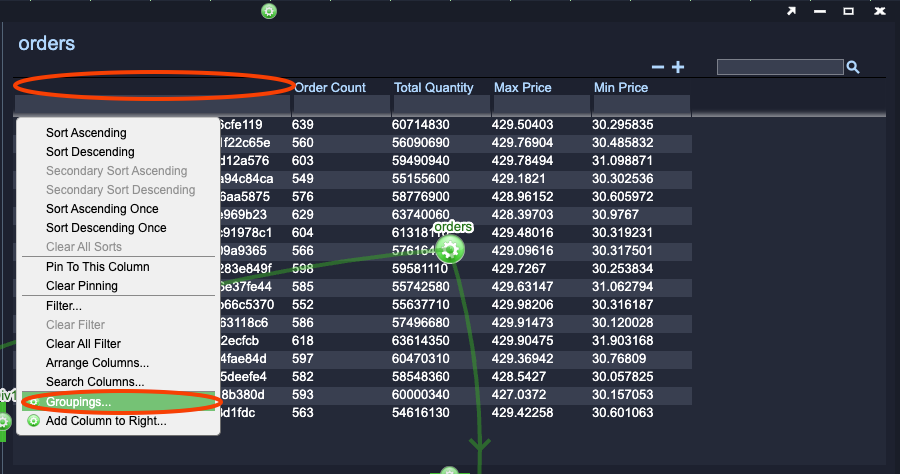
Click on the column header for the Tree portion of the Tree Grid Visualization (to the left of Order Count) and select Groupings.
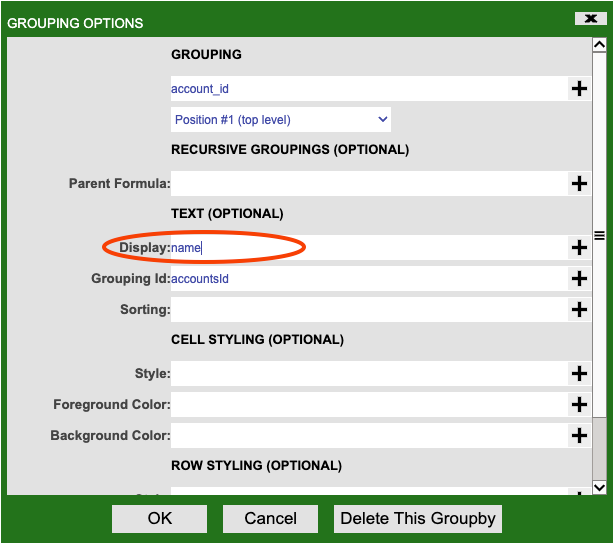
Select Grouping 1 which is currently on account_id. In the Grouping Options window that pops-up change the Display field to name. The grouping will still be based on Account Id but what will be shown is the Account Name instead.
Click OK and then Submit.
You should now see the Account Name in the Tree Grid Visualization.
There is one final change to make. You may notice that the Id column in the order details Table Visualization is blank.
- Open the
order_detailsdatamodel. - Click the orange Test button.
- Click Apply Changes on the Update Schema window that pops up.
- Flick Finish
- Edit the orders Table Visualization Id column so that the Display field contains
orders_id.